Cash Flow Statement

Hi All

My question follows on from the Financial Reporting using Power BI showcase

I am creating a Matrix visual for a Cash Flow statement - see attached file.

The problem that I am facing is - I am not sure why the 5 subtotals described below are not populating for the Cash flow Template. The rows are blank. I created measures for all the subtotals already and included them in the SWITCH TRUE() measure created.

See details of subtotal rows that have blank values in the Cash Flow Template

  1. Net cash inflow from operating activities

  2. Net cash flow used in investing activities

  3. Net cash flow (used in) generated from Financing Activities

  4. Net cash and cash equivalents at the start of the year

  5. Net (decrease) increase in cash & cash equivalents during the year

Many thanks

CashFlow Statement.pbix (102.5 KB)

Hello @atin,

Thank You for posting your query onto the Forum.

The sub-totals for the following categories which you’ve mentioned is showing blank because the context that you’re referring while calculating sub-totals for each category comes from two different tables i.e. “Cash Flow Data” as well as from “Cash Flow Template”.

So below is the below that you’ve written as follows -

Net Cash Flow - Operating Activities = 
CALCULATE('Cash Flow Analysis'[Cash Flow Amount] , 
    FILTER('Cash Flow' , 
        'Cash Flow'[Cash Flow Category] = "Net cash inflow from operating activities" && -- Sub - Total line item not there in Cash Flow Data
        'Cash Flow'[Cash Flow Type] = "Operating Activities" ) )                         -- Only getting referenced is the Type from that
    											                                            Cash Flow Data

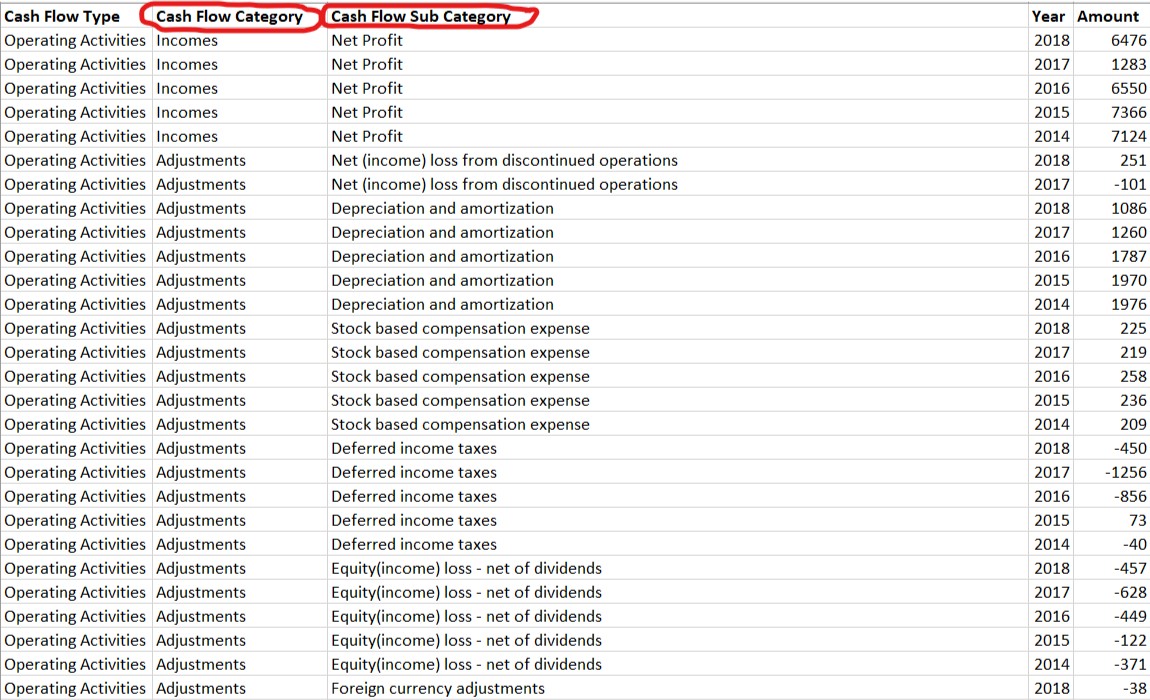
Now, if you see in the above formula, you’ll observe that you don’t have any such line item in your “Cash Flow Data” under the “Category” column with the name as - “Net cash inflow from operating activities”. This line item is from “Cash Flow Template” and not from “Cash Flow Data”.

And while calculating the sub-totals for each of the categories you’ve referenced this two tables in all of your measures. Since this line item does not exists at all in your “Cash Flow Data” it’s showing you as blank.

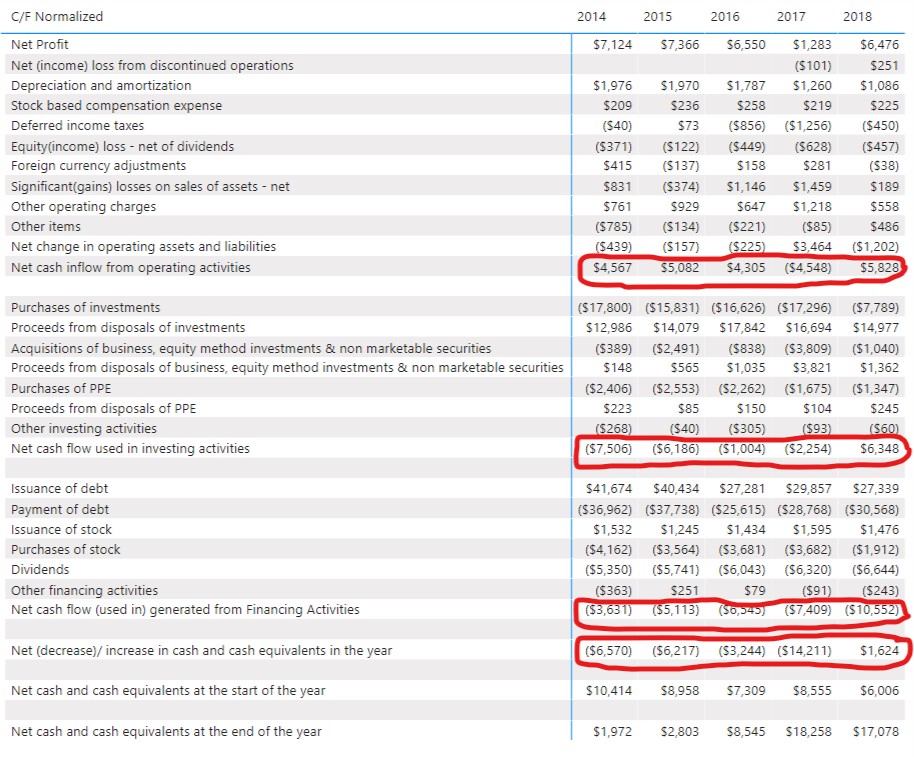
Now, if you observe the “Financial Reporting” video as well as working of PBIX file provided by @sam.mckay you’ll see that he has calculated the sub-total for each categories and those line items exists under his categories.

For example -

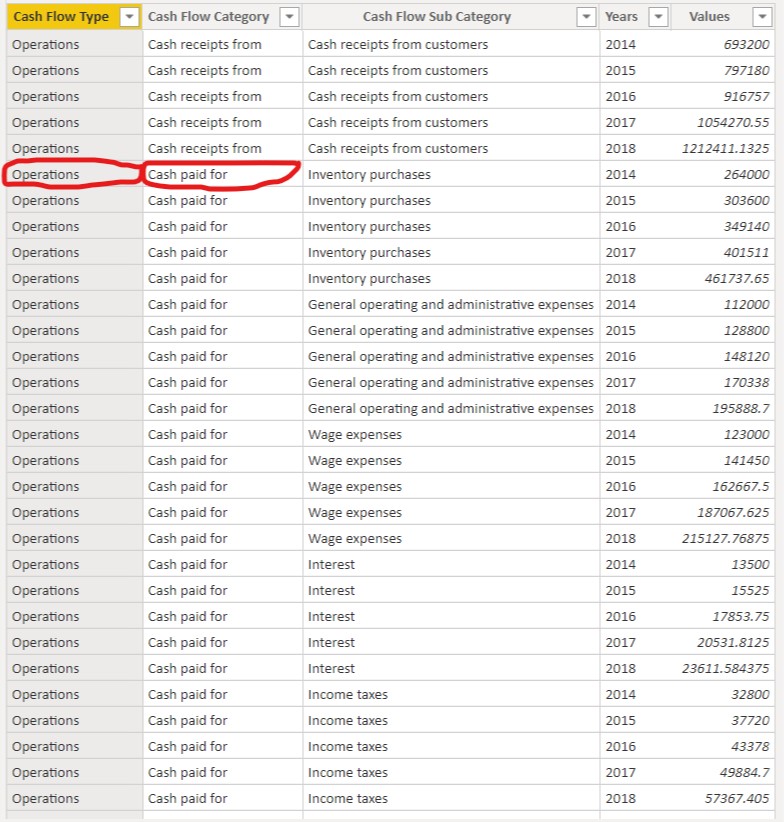
Cash Paid For - Operations = 
CALCULATE( [Cash Flow Values],
        FILTER( 'Cash Flow Data',
        'Cash Flow Data'[Cash Flow Category] = "Cash paid for" && -- This Line item exists under the Category column
        'Cash Flow Data'[Cash Flow Type] = "Operations" ) ) -- The referenced table is also Cash Flow Data and not Template one

Below is the screenshot provided for the reference.

Now, if you see in your case, you’ve have the Cash Flow type as “Operations” but “Net cash inflow from operating activities” is not under the “Cash Flow Category” it’s under the Template and this has happened because while designing the data for Cash Flow this line item and all other line items which contains this type has been ignored from it. Once you add the following line items against which it’s showing you as blank you’ll see the figures against those line items.

I’m providing the working of @sam.mckay PBIX file of Cash Flow Statement for your reference which I’d used while practicing the Financial Reporting.

Hoping you find this useful and helps you in your analysis. :slightly_smiling_face:

Thanks & Warm Regards,
Harsh

Cash Flow Statement.pbix (876.3 KB)

2 Likes

Hello @atin,

In your “Cash Flow Data”, I’ve added one more column which is “Cash Flow Category” and the column which was earlier classified as category as been moved to “Cash Flow Sub Category”. Below is the screenshot provided for the data -

Now, under each category I’ve bifurcated them under 3 types. This are as follows -

For Operating Activities -

  1. Net Profits are classified under the type “Incomes”.
  2. Other Operating Items are classified under the type “Others”.
  3. And lastly, all other items which do not constitute under the aforementioned types, they are included under the type “Adjustments”.

For Operating and Investing Activities -

  1. Your receipts items has been included under the type “Cash Receipts From”.
  2. Your expenses items has been included under the type “Cash Paid For”.
  3. And lastly, all other line items from each of this activities are classified under the type “Other”.

Now, after making changes in the “Cash Flow Data”, I’ve calculated the “Sub-Totals” for each of these types. And then using a “SWITCH( TRUE() )” logic have calculated the master measure which @sam.mckay has shown in his video. Once I drag this measure into the matrix, all the lines which were showing blank previously in your case now shows the actual figures. Below is the screenshot provided for the reference -

Firstly, I’m attaching the screenshot of your result -

I’m attaching the Excel as well as the PBIX file of my working for the reference.

I’ve grouped the measures under their respective folders name so that you can analyze how each of them are calculated to arrive at the correct sub-total figures. Below is the screenshot provided for the reference -

Cash Flow Statement Solution - 4

Hoping you find this useful and helps you in your analysis. :slightly_smiling_face:

Please Note: I’ve not made any changes in your template data and as mentioned earlier I’ve made the changes in the “Cash Flow Data” because that’s where the problem occurred.

Thanks & Warm Regards,
Harsh

Cash Flow Statement - Harsh.xlsx (13.7 KB)

Cash Flow Statement - Harsh.pbix (101.9 KB)

3 Likes

Hi @Harsh

Many thanks for getting back. Your examples have been extremely helpful as I am now able to trace what I was doing incorrectly.

I was initially going with only a category column in my data and not recognising that its best to have both a category & sub category column which makes the SWITCH TRUE function work.

I have now amended my data and amended my SWITCH TRUE function and this all works now.

I also liked how you introduced Folders into the Measure Groups ( ie Investing, Operating & Financing, C/F Key Measures). It makes the measures easy to understand and also better organisation . I have now incorporated this into mine as well.

Have a great week :slight_smile:

Best wishes

1 Like

Hi @atin, I hope that you are having a great experience using the Support Forum so far. We’ve recently launched the Enterprise DNA Forum User Experience Survey, please feel free to answer it and give your insights on how we can further improve the Support forum. Thanks!

Thanks for the solution posted @Harsh!

@atin and @EnterpriseDNA You’re welcome. :slightly_smiling_face:

@atin I’m glad I was able to help you and you were able to achieve your analysis.

Thanks & Warm Regards,
Harsh