Capture date from Date Slicer

If I have a slicer with Date as the selection, can we capture the value and use it a measure ?

I thought we can use SELECTEDVALUE, but as I tried it is blank.

So my measure is like this "MyDate = SELECTEDVALUE(Date[Date])

As I put in Card, it is blank, same if I put the measure in some fact table.

If use MAX, it will give me the maximum date in my Date dimension.

Please help.
Thanks

@axaeffect,

Here’s a link with one way to do this:

https://community.powerbi.com/t5/Desktop/Get-start-and-end-date-from-Timeline-Slicer/td-p/71317

Basically, just MIN and MAX of ALLSELECTED on your date field.

SELECTEDVALUE returns a blank since it doesn’t know which of the two dates to select (to me, it would make more sense if it returned an error message instead, noting the ambiguity).

Hope this is helpful.

  • Brian

Yes, it turn out it depends on how we display the date slicer. If single value, we can use SELECTEDVALUE, and if in between (2 dates) then we can use MAX.

But there is another challenge, all this MIN/MAX/SELECTEDVALUE is not allow to use as a calculated column if I’m using Direct Query.

And if I’m using measures, it looks ok at first but if I’ using that measure (MAX(Date[Date])), in DATEDIFF function to calculate some date difference, the calculation is wrong and I don’t why ?

The other day I’m reading somewhere that Enterprise DNA has a membership program to support user cases/project ?

Thanks,

@axaeffect,

You are definitely going to want to do this via measures if you want it to be responsive to the slicer changes, which works fine with DATEDIFF. Here’s how I set it up:

Date Harvest Min = 
    CALCULATE(
        MIN( Dates[Date] ),
        ALLSELECTED( Dates[Date] )
    )

And then the same thing for MAX, and then calculate the difference via DATEDIFF:

Date Difference = 
    DATEDIFF(
        [Date Harvest Min],
        [Date Harvest Max],
        DAY
    )

Full solution file attached below.

Re: your question about project consulting services, I’ll have to refer that one to @sam.mckay.

Hi BrianJ,
Thanks for the help.
The other date, btw, is from my transaction table. However I tried the CALCULATE, and it works to holds the selected date from slicer, but to calculate by DATEDIFF, the result is wrong.

Measure for selected date :
SelectedDate = CALCULATE(
MAX( Dates[Date] ),
ALLSELECTED( Dates[Date] )
)

This is my measure for DATEDIFF :slight_smile:
Age = SUMX(
‘MyTransactions’,
DATEDIFF(
[SelectedDate],
‘MyTransactions’[INVOICEDATE],
DAY)
)

No error for the formula, but the calculation is wrong.

Thanks again,

@axaeffect,

At this point, it would really help if you could post your PBIX file, so that I can get a better handle on what you’re trying to do, and also see if some of the problem is a result of your data model structure.

Thanks.

  • Brian

Hi Brian,

I’ve created a sample PBIX which close to my real one. Since it is a Direct Query and need to connect to SQL Server.

The connection I created is to local SQL Server with sample database AdventureWorksDW. Hope you’re able to open it. :grinning:

Testing_AgingAdventureWorksDW.pbix (33.1 KB)

Thanks again for your kind assistance.

Just to add, what I mean is hope you have that sample DB.
And the table I’m using is only 2, DimDate and FactInternetSales.

Many thanks.:grinning:

@axaeffect,

Actually having a problem loading the AW database. Would you be able to send an import rather than direct query version of the PBIX?

Thanks.

  • Brian

Hi Brian,

Of course, here it is as attached. Only the reason is, because it is Direct Query so I have this problem, since some limitation like those DAX function that not allowed in Direct Query calculated column. Testing_AgingAdventureWorksDW_Import.pbix (719.8 KB)

Many thanks,

@axaeffect,

OK, two major problems with your Aging measure:

  1. because you are changing filter context (to ALLSELECTED), you need to wrap this in a CALCULATE statement; and
  2. if I understand what you’re trying to do here correctly, SUMX is not needed.

Here’s the rewritten measure:

Aging = 
    CALCULATE(
        DATEDIFF(
            SELECTEDVALUE( FactInternetSales[DueDate] ),
            [SelectedDate],
            DAY
        ),
        ALLSELECTED(
            DimDate[FullDateAlternateKey]
        )
    ) 

As you can see from the screenshot below, this works fine except for the fact that it doesn’t produce a grand total, because there’s no evaluation context for the total line.

image

In order to get the proper grand total, you need a more complex version of the same measure:

Aging with Total = 

VAR VirtualTable =
    CALCULATETABLE(
        ADDCOLUMNS(
            FactInternetSales,
            "AgingVirt", [Aging]
        ),
        ALLSELECTED( DimDate[FullDateAlternateKey] )
    )
RETURN
IF( 
    HASONEVALUE( FactInternetSales[SalesOrderNumber] ),
    [Aging],
    SUMX (
        VirtualTable,
        [AgingVirt]
    )
)

For more information on how to get correct totals, check out this recent post which has links to a number of excellent videos by Sam explaining this issue in depth.

Full solution file attached below.

Hope this is helpful.

Hi Brian,
This is great. Thanks so much for your assistance and help. It took me sometime to understand the measure to be honest.

Do you mind to explain a bit, while in CALCULATETABLE -->
CALCULATETABLE(
ADDCOLUMNS(
FactInternetSales,
“AgingVirt”, [Aging]
),
ALLSELECTED( DimDate[FullDateAlternateKey] )
)

Is it this virtual table will only contain the date in current row?

Secondly, my final goal is actually to put the Age into some aging bucket. There is one table I have with the setup of Min and Max like usual Aging report.
Unfortunately, even when I try to hardcode the bucket category, I always have an error.
I tried with simple category first, by hardcode it like below, but it is not correct and even the row is wrong.

Aging bucket =
VAR VirtualTable =
CALCULATETABLE(
ADDCOLUMNS(
FactInternetSales,
“AgingVirt”, [Aging]
),
ALLSELECTED( DimDate[FullDateAlternateKey] )
)

VAR TotalAging = IF(
HASONEVALUE( FactInternetSales[SalesOrderNumber] ),
[Aging2],
SUMX (
VirtualTable,
[AgingVirt]
)
)

RETURN IF(TotalAging < 7, “Small”,“Big”)

Can you help to tell what I should do to correct it ?

Really appreciate your help.

Thanks,

Just one quick thing here, click on the banner at the top of the post to see how to imput formulas into the forum. It helps in reading and understanding these.

Thanks
Sam

1 Like

@axaeffect,

I’ll try to answer all of your questions above and in this post, since they are closely related.

I can tell from the problems you’re having with your measures that you need to develop a better understanding of evaluation context, filter context and row context. These are the foundational principles of all DAX calculations, and even with focused study they take a while to fully sink in. I think the best place to start is with this course:

focusing particularly on all the sections related to context, CALCULATE, and table functions. If you’re anything like me, you’ll probably have to watch these over and over and over again as you work through your Power BI projects. However, one day it all will click into the place, and you’ll feel like this:

The next foundational concept to focus on is “measure branching”. In your second post, you are on the right track, but you’re trying to do too much within a single measure. In measure branching, each measure typically does one specific thing, and they build logically upon each other, in increasing complexity. This video does a great job explaining the concept and providing examples:

OK, on to your specific questions:

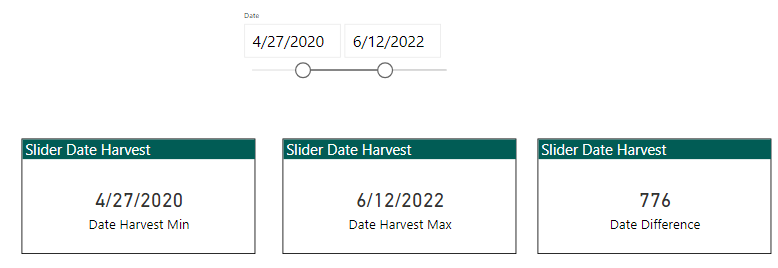
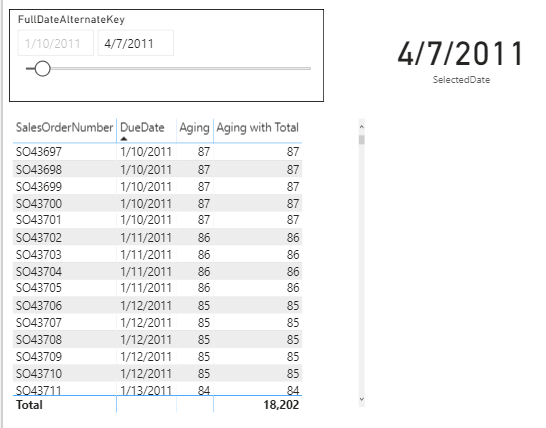
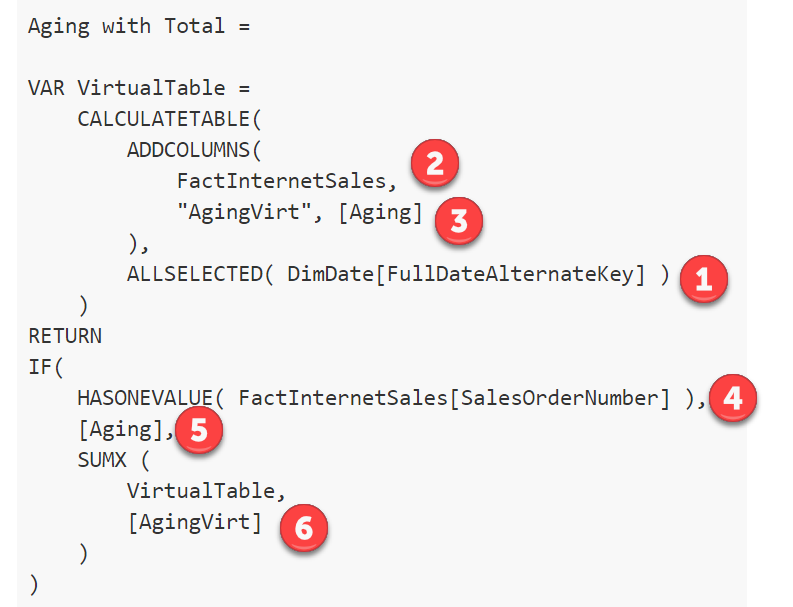
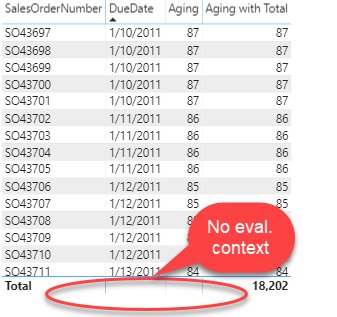
  1. What is the “Aging with Total” measure doing?

  1. filtering your fact table, based on the selected date range harvested from your slider
  2. making a virtual copy of your filtered fact table
  3. adding a virtual column to 2) with the results of your Aging measure for each row of the virtual table
  4. checking to see if each row of the matrix has a single value for the SalesOrderNumber field
  5. if yes (which will be true for every row that isn’t the final total row), it just applies the Aging measure
  6. if no (meaning we are in the total row of the matrix), it takes the sum of the entire column virtual aging column we added in step 3)

This is all necessary since there is no proper evaluation context for the regular Aging measure to operate on in the total row.

image

  1. What is SELECTEDVALUE doing?

There’s not a specific Enterprise DNA video on this function, but I think the following provides a good explanation:

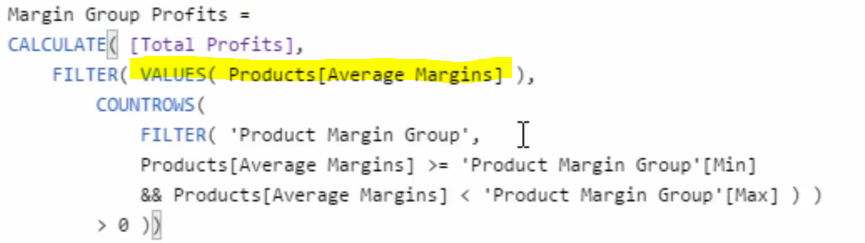
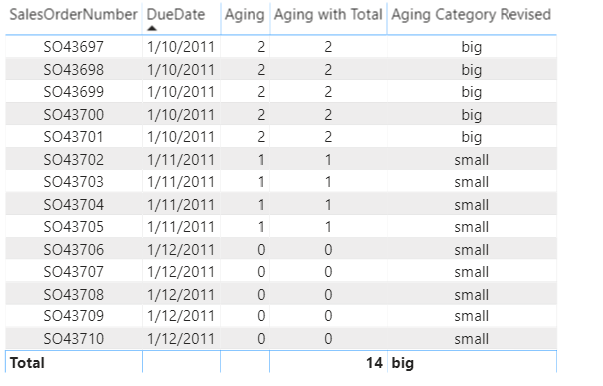
  1. Aging Category Measure

You had the right idea here, but didn’t need the CALCULATE statement, nor the variable/SELECTEDVALUE construct. In this case, just let the evaluation context and measure branching do most of the work, and use a simple IF statement:

Aging Category Revised = 
IF(
    [Aging with Total] <=1,
    "small",
    "big"
)

image

Hope this answers your questions. Full solution file posted below.

Work through the videos above, and if you run into other problems, just give a shout.

1 Like

Hi Brian,

Greatly appreciate of all this. I surely will watch and learn from those video.
In the mean time, just to confirm, the “Aging Category Revised” measure, it produces the “unnecessary” rows, does to add ISBLANK, solved this case :

Aging Category Revised =
IF(
ISBLANK([Aging with Total]), BLANK(),
IF(
[Aging with Total] <=1,
“small”,
“big”
)
)

well, it looks does, just to make sure… :slight_smile:

Many thanks for this great help.

@axaeffect,

Nice catch. Your revised measure will return a blank for dates outside of the selected range. I would probably go a step further and just take those rows out entirely by putting a filter condition on the visual.

  • Brian

1 Like

Hi Brian,

One last thing (hope it is the last). As I continue to create a measure to pick the range grouping from a range table, I followed this site video which is :

The DAX code is normally like this :

…and the highlighted “VALUES(Products…” is a calculated column created previously.

So in my case, I don’t have that, instead we create measure. I assumed I need to create virtual table first, then use that virtual table in that kind of CALCULATION of margin category measure. However the virtual table is not accessible in that VALUES function.

Is it possible to use the same DAX formula in my case ? or there is another approach ?

Basically what I want to achieve is report looks like this :

Many thanks in advance,

@axaeffect,

I don’t think this would be too difficult. You should be able to create two additional measures summing the values you want to display (e.g., sales, costs, etc.) filtered by [Aging Category Revised] = “big” and [Aging Category Revised] = “small”, then use those to create the desired matrix visual.

Work through the videos above, give it a try, and if you run into problems just give a shout.

  • Brian

Hi Brian,

A bit confuse now, since basically I don;t need the [Aging Category Revised] anymore.
Currently I created a range table, something like this :

Range name Min Max
<=2 0 2
3-5 3 5
6-10 6 10
> 10 11 999

And based on that video, I need to create a measure to iterate through the range table, right ?
Something like :
[Age range] =
CALCULATE([Total sales amount],
FILTER(VALUES(FactInteretSales[Age])`,
COUNTROWS(
FILTER(Range,
FactInteretSales[Age] >= Range[Min] &&
FactInteretSales[Age] < Range[Max]
)
) > 0
)
but that FactInternetSales[Age] is supposed to be a calculated column whereas my “age” is a measure which is not accessible in the formula. So the measure above is actually not happening in reality, because I cannot even type the [Age] measure that we create previously.

So I think then I should use VAR and make a virtual table first instead, so I did tried that, to create the measure to be something like :
Aging range =
VAR VirtualTable = CALCULATETABLE(
ADDCOLUMNS(FactInternetSales,
“TmpAging”, [Aging with Total]
),
ALLSELECTED(DimDate[FullDateAlternateKey])
)

    RETURN CALCULATE([Total sales amount],
                    FILTER(VirtualTable,
                    COUNTROWS(
                        FILTER(Range,
                            [TmpAging] >= Range[Min] &&
                            [TmpAging] < Range[Max]
                        ) 
                    ) > 0
                    )
    )

I’m not sure it is correct, even though there is no error, but if I try to use it, it falls under the last group only, so it is wrong.
When I pull my Range name in a table then use the measure, I only get like this :

Range name Aging range
> 10 (total)

when basically it should not, because it has some age with only 1 or 2 days.

So I’m wondering how to correct that measure.

btw not sure why I cannot use the preformated text, sorry.

Thanks in advance,

@axaeffect,

Please post your PBIX file (import, not direct query). That will definitely help me sort out what’s going on, since I also want to look at this in the context of your data model.

Thanks.

  • Brian