“kindly request you to share the above screen shot file with me … just wanted to know have you added visual level filter of calendar year month on the visuals wherever you have used measures starting with Total … it would be good if you can share the pbix file with checks what you have done.”
Haven’t used any visual filters. The Pbix file is attached.
“Also it would be good if you can help me understand what you are trying to derive with above analysis”
Measures with calculate function through metric calculations table and through default table visualization.
It is not a good practice to use the slicer of calculation item for the normal metrics once I removed the edit interaction with the slicer it worked.
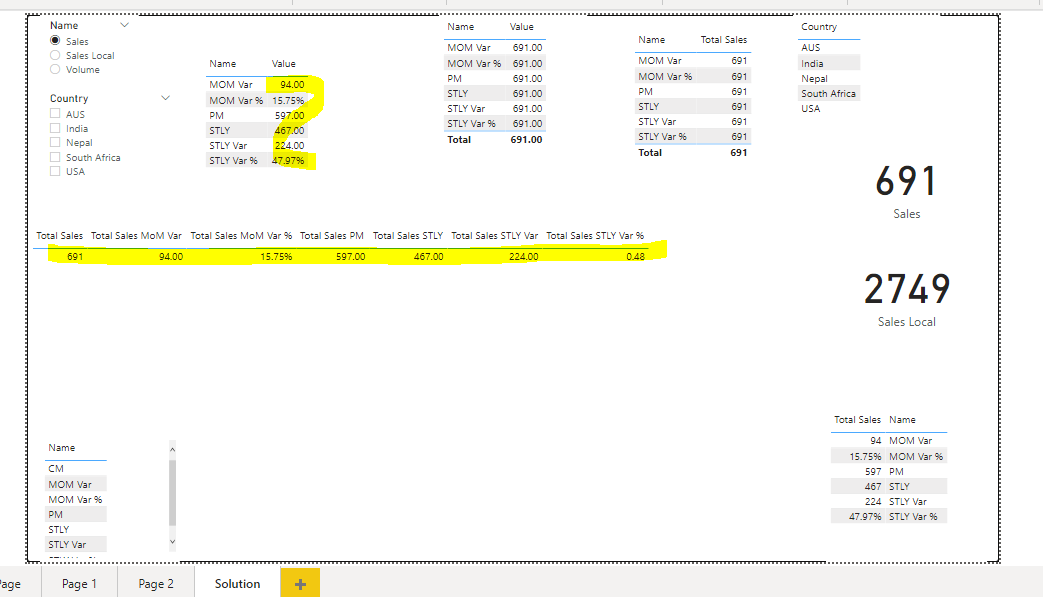
Kindly not that here the my requirement is not related to matching the values, my requirement is straight forward and keeping it very simple is it possible for us to replicate the visual on page 1 screen shot below using Calc Group
Hi @Vishy! We noticed that your inquiry was left unsolved for quite some time now. We strive to answer ALL inquiries in the forum. However, if you are sure that you provided all pertinent context to your concerns and read how to use the forum more effectively and still find your question unanswered, you can check out tutorials to learn this yourself as your membership also comes with relevant resources that may help you with your Power BI education.
While our users and experts do as much as reasonable to help you with your inquiries, not all concerns can be attended to especially if there are some learnings to be done. Thank you!