I have a scenario here where in , it would be of great help if some one can guide me whether the use case mentioned below can be done with Calculation group: -
Requirement -
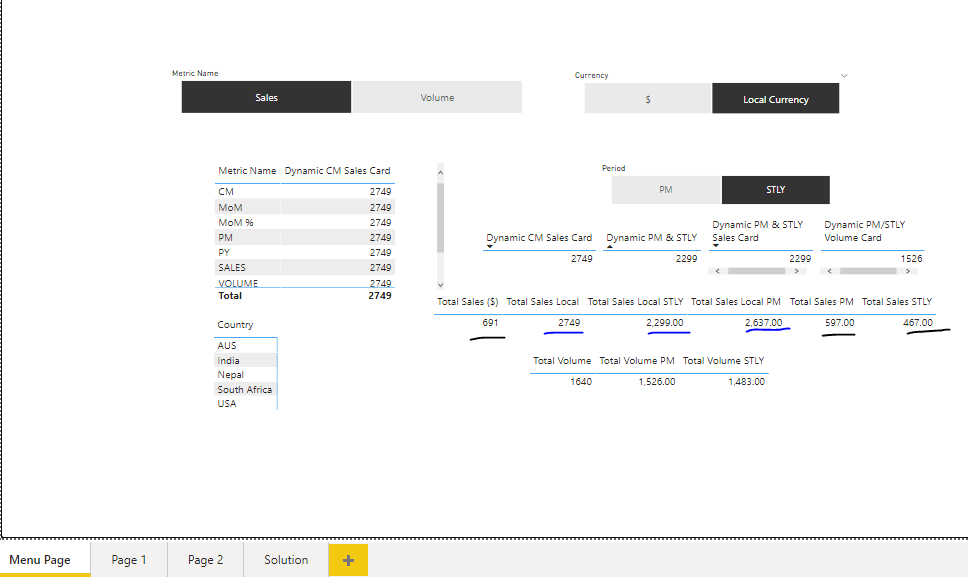
Having an opening page and based on the metric, currency and previous month/ STLY selection, the other pages of the report should get filtered.
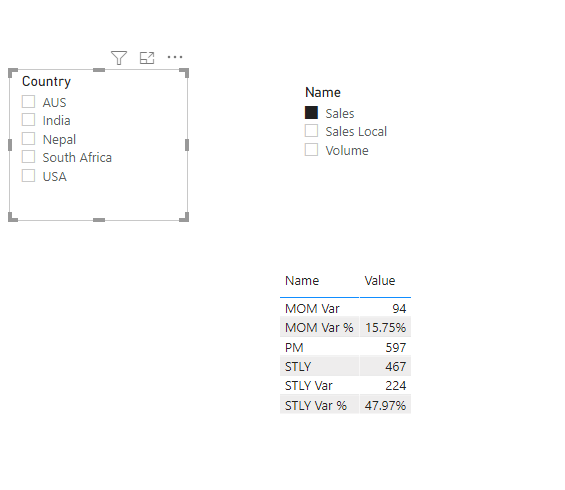
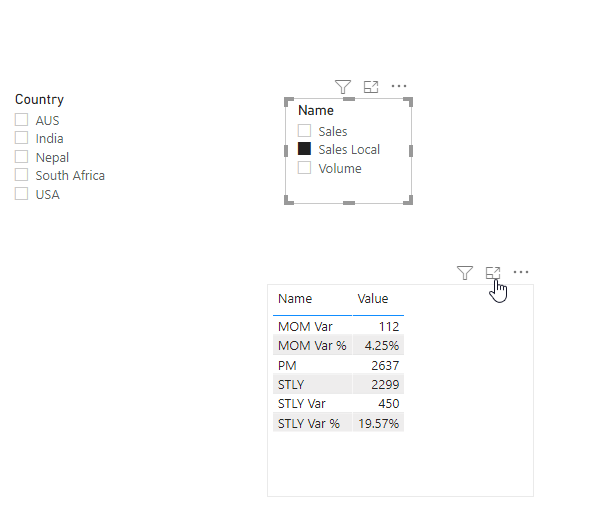
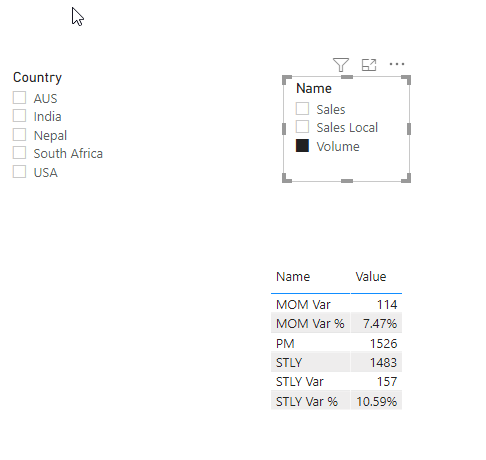
If I select PM or STLY , in a table visual the SAles amount PM value should be updated with STLY same should have in multi row card visual.
I have achieved this scenario using Dynamic measure and need to understand whether same can be done with Calc group. Attached is the file for reference. sample test - dynamic Measures.pbix (76.0 KB)
Currently in the assignment which i am working , the report has
1.Around 7 business critical metric involved. These metrics needs to be represented in a format which includes less number of pages and all comparisons should be included.
2. So this old report has lots of bookmarks and combination of dynamic measures Example ,on a single page, bookmarks to move between these 7 metrics and then within that switch between Previous month and STLY comparison for Tabular views and also an ability to move across graphical view and tabular view.
So to handle all this I am planning to use the approach of Dynamic measure creation using switch statement which would automatically reduce the book marks in the report( the same thing what I have done in the sample report attached - exact use case), further using a combination of page navigation to move between tabular or graphical view on respective pages. And not to forget inclusion of a menu page in the beginning where in user would select the metric which would get sync across different page and do the necessary analysis.
So if you see considering 7 measures and each measure having PM, MOM , MOM var, MOM Var % , STLY, STLY var and STLY var %, CM measures which totals upto 8 for each metric and considering 7 metrics in total. The total number of metrics just increases wherein i am doing the same calculation.
So considering above points I wanted to explore the use of Calculation groups as part of solution for this assignment wherein along with reducing the number of bookmarks, number of measures can also be reduced and same functionality can be retained.
It would be great if you can provide your expertise here on calculation group to help resolve this use case.
@Vishy I will try to do it with Calc Groups and it will take sometime as first I have to understand your model and calculations first but I will get back to you. I will ask you for more info if required.
I am attaching the PBIX file for you to look at & you can surely let me know if more can be done for the comprehensive solution. I had a good time working on this one.
Hi @Vishy, did the response provided by @MudassirAli help you solve your query? If not, how far did you get and what kind of help you need further? If yes, kindly mark as solution the answer that solved your query. Thanks!
Hi @Vishy, we’ve noticed that no response has been received from you since the 10th of February. We just want to check if you still need further help with this post? In case there won’t be any activity on it in the next few days, we’ll be tagging this post as Solved. If you have a follow question or concern related to this topic, please remove the Solution tag first by clicking the three dots beside Reply and then untick the checkbox. Thanks!
Hi @Vishy, we’ve noticed that no response has been received from you since the 16th of February. We just want to check if you still need further help with this post? In case there won’t be any activity on it in the next few days, we’ll be tagging this post as Solved.
Apologies for the delayed response, thanks for the calcs!!
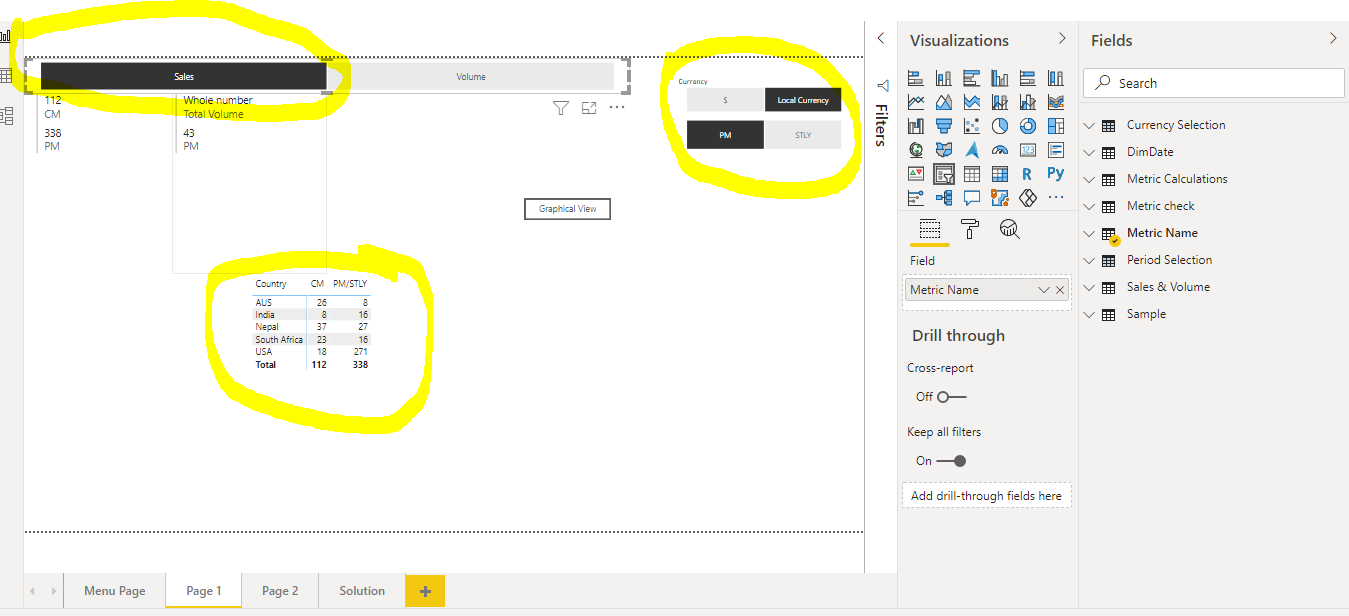
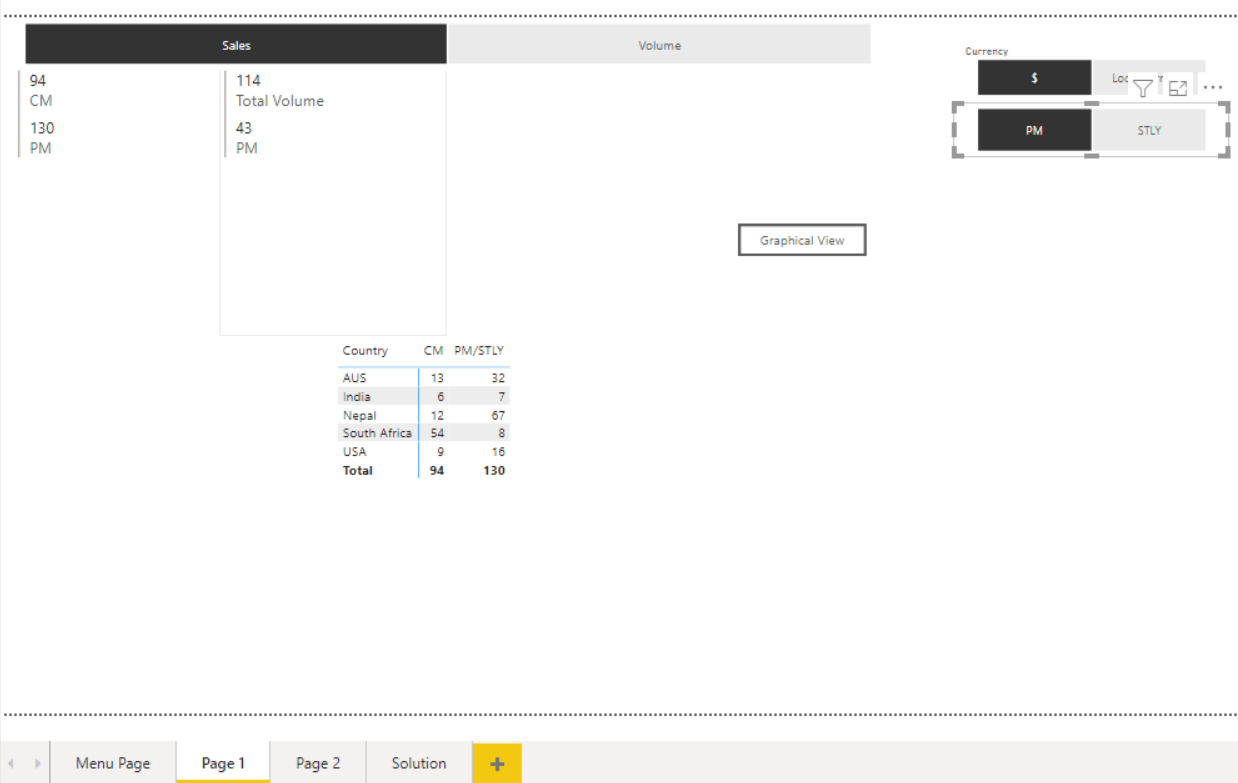
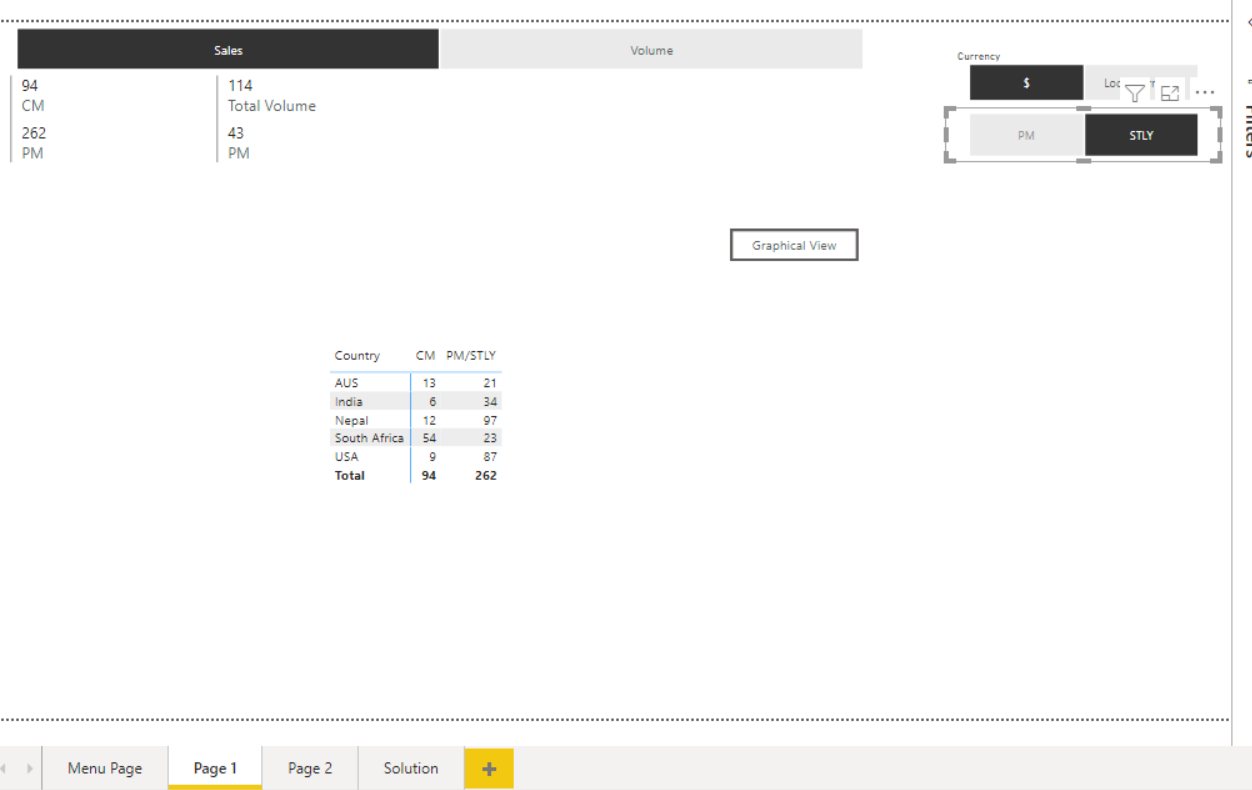
However what i am looking for in this solution is consider the page 1 in the sample pbix… so as a user i would select 1st the metric example sales and then i would select local currency or dollar and if needed within that i would select current month or previous month values … now what i needed is the CM column should gets dynamically changed showing LC or dollar when selected also the PM/STLY should show PM or STLY based on the slicer selection , whereas what i observe is with Calc group we have a totally different column for STLY and so on. Screen shot from the Page 1
What change you are looking to see for each selection in the Country Table. If you could write down the business logic, that would be much appreciated.
Hi @Vishy, did the response provided by @Kumail help you solve your query? If not, how far did you get and what kind of help you need further? If yes, kindly mark as solution the answer that solved your query. Thanks!
So the 1st page is created by me based on dynamic measures , I want the similar kind of implementation with Calc Group(That is the requirement)
Now the business Logic is as follows -
based on the $ or local currency selection as said by you the CM value and PM /STLY value changes and within that if you select PM or STLY the column PM/STLY would display the values for respective PM or STLY based on user selection. What does that mean !! Example - The Table visual is showing the sales in Dollar amount for both columns, with PM/STLY column displaying Previous month value in Dollars as user has selected PM in the slicer.
So is it possible to implement similar kind of functionality with Calc group with not having separate calculation item for PM and STLY whereas having a single calculation item with dynamic PM/STLY switch
Hi @Kumail -
Total sales should be either as follows-
Total sales dollar pm
Total sales dollar STLY
Total sales local pm
Total sales local STLY
Based on the permutations and combinations that user selects from the slicer and using calc groups…
With dynamic measures it is possible something which you can see in page one
Remember the table in page one has CM value which in DAX is always total sales= sum(sales) and shows value for local currency or dollar and doesn’t change based on pm or STLY selection where as the column besides that shows either PM or STLY value either for dollar or local currency based on user selection from the slicer pm :STLY and local currency: dollar
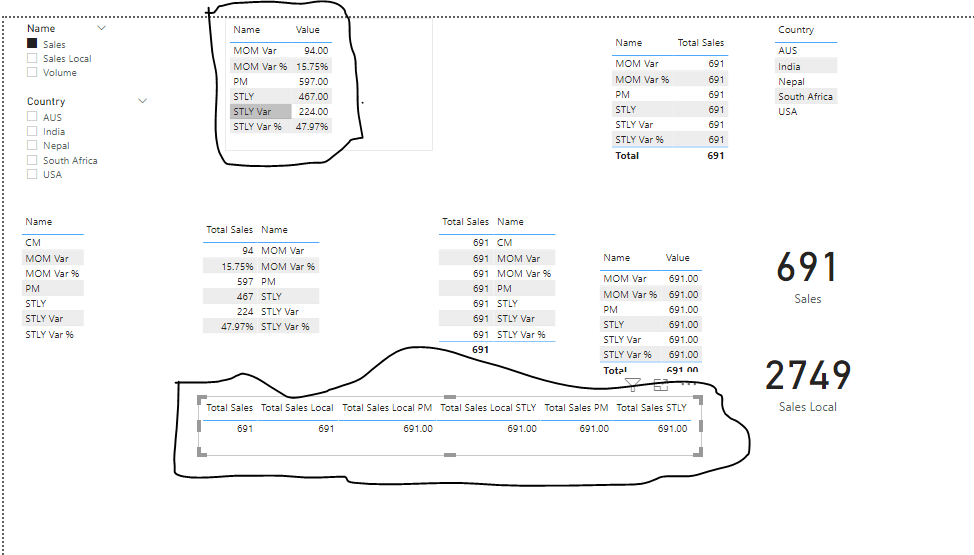
@Kumail- kindly request you to share the above screen shot file with me … just wanted to know have you added visual level filter of calendar year month on the visuals whereever you have used measures starting with Total … it would be good if you can share the pbix file with checks what you have done.
Also it would be good if you can help me understand what you are trying to derive with above analysis