Calculating percentage change and want to hide current year

I have a matrix where i am showing the total revenue and qty sold from year to year for past 5 years. I am displaying the percentage change from the previous year . I have two issues:

  1. i want the current year to show the percentage change YTD, while all the previous years will show the full year percentage changes. If we can’t do this, then i am happy with the current year percentage change being blank also.

image

  1. the first year, since there isn’t revenue the year before, then the matrix is showing ‘infinity’. I would like this to be blank.

Ok sure,

If you can in future add the relevant formulas that would be helpful.

I think though that you should be able to solve this using the techniques reviewed here.

Around the 5:27 min mark gives you the actually formula technique

See how you go with these ideas.

I’m confident you’ll quickly see what you need to do here.

Chrs

Sam, I followed the video and got it to work when displaying in a Table. 688 is the number of inspections up through today for 2017.

image

Using the following:

Inspections = COUNT('ISN orders'[oid])


SameLY Insp = CALCULATE(COUNT('ISN orders'[oid]), SAMEPERIODLASTYEAR(Dates[Date]))


Insp YTD SameLY = 
VAR LastInspectionDate = TODAY()
VAR YTDInspections = TOTALYTD(COUNT('ISN orders'[oid]), SAMEPERIODLASTYEAR(Dates[Date]))

RETURN
IF(MIN(Dates[Date]) <= LastInspectionDate, YTDInspections, BLANK())

NOTE: the reason I used TODAY() instead of MAXX like your example is we have some orders that have been booked early for Nov and Dec, so it was pulling the entire year in when I only want the inspections up to today (Oct 30, 2018) and compare to Oct 30, 2017.

However, I want to show the total for 2018 (786) vs total for 2017 (688) up to current date. But when I try to show the sums for the ytd, I get the totals from the entire year in 2017 (784). I need it to read for Insp YTD SameLY = 688.

image

I feel like I am close.

To clarify, my ultimate goal for this matrix is to show the growth rate through the current date of 2018, while the past years will be the growth rate for the entire year. Because in 2018, the growth rate for inspections is 14% (through 10/30/2017 = 688 inspections vs through 10/30/2018 = 786 inspections).

image

I think within this particular forum post lies the answer to this one

Check out this formula below
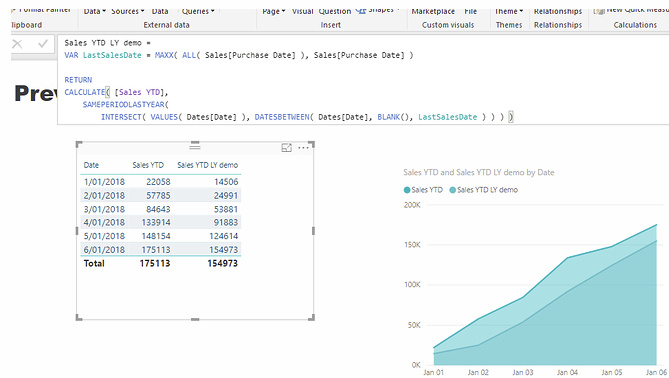
Sales YTD LY demo = 
VAR LastSalesDate = MAXX( ALL( Sales[Purchase Date] ), Sales[Purchase Date] )

RETURN
CALCULATE( [Sales YTD],
    SAMEPERIODLASTYEAR(
        INTERSECT( VALUES( Dates[Date] ), DATESBETWEEN( Dates[Date], BLANK(), LastSalesDate ) ) ) )

Can you try to integrate the technique here into your formula?

Give this a go.

What INTERSECT does it takes one table and compares it to another table (all virtually here).

What this will do it only give you a context for the calculation up to the last date that you want.

See here for how it worked in the forum example

image

See how you go with this idea.

Chrs

Thanks Sam. This worked great. I only had to change the LastSaleDate = Today() and it worked perfect. Thanks for the push over the edge.