Hey Sam, thanks for all of the detail you provided. I hope I can do a better job explaining this metric.
Attached is an updated PowerBI file. I created a new group of measures for the DAX you provided and added what I believe is the correct CumNetProfit to keep things clean. I also created a new tab to see and validate the data called MaxDD Testing.
Strategy Performance Dashboard - Beta v3.pbix (2.5 MB)

I’m attaching an example of this dataset in excel with the correct Max Drawdown.
MaxDD in Excel using the Same Dataset.xlsx (1.6 MB)
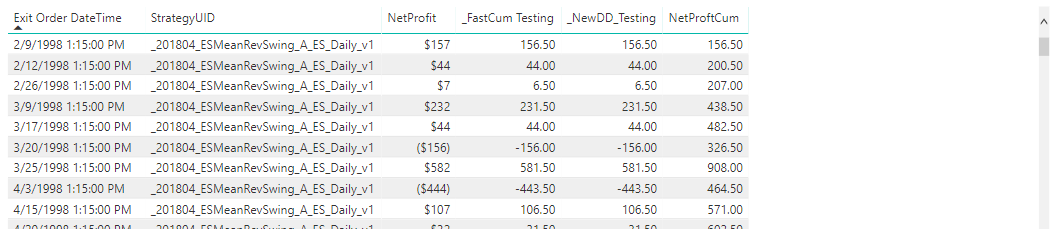
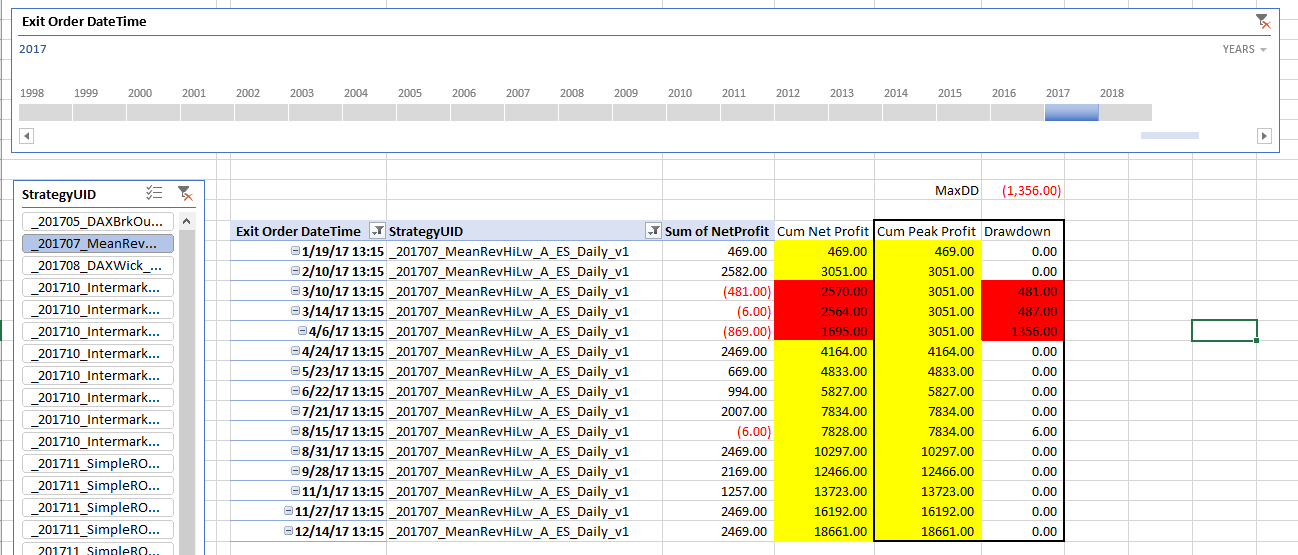
A drawdown is when the cumulative net profit is less than the prior peak cumulative profit so cumulative profit can’t be aggregated as it needs to calculate each drawdown in the equity curve then take the max. Below is an example of what this looks like in the data. The columns in red are drawdowns, because the cumulative profit is less than the prior peak in cumulative profit.
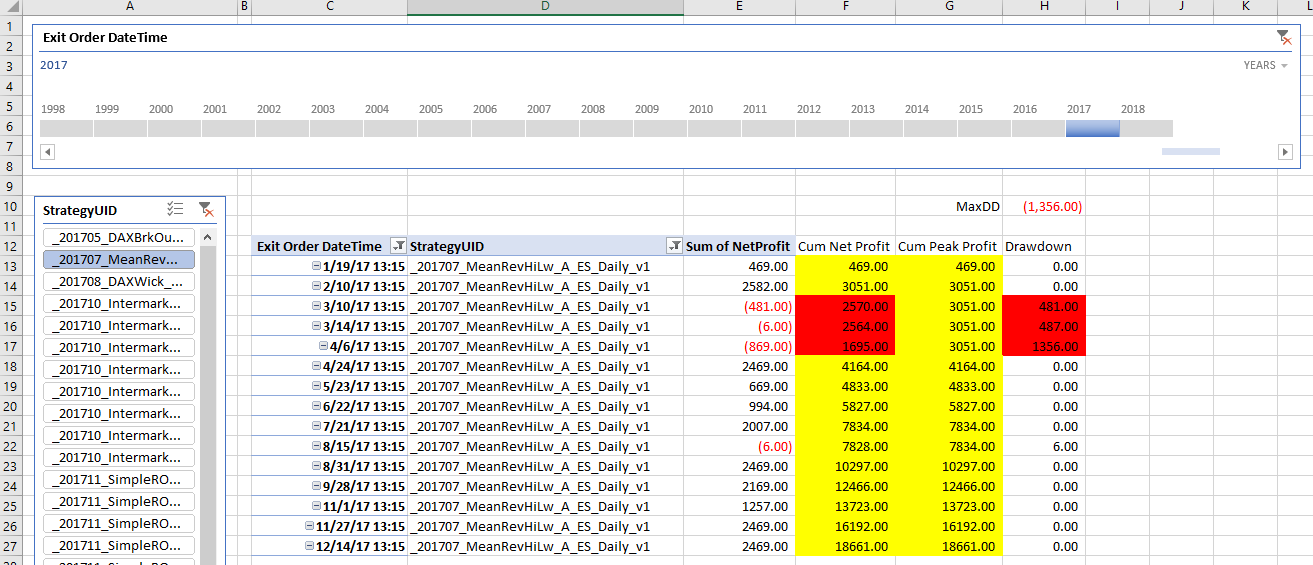
The cumulative profit you have called _FastCum won’t work because it’s just an aggregated Net Profit.
_FastCum Testing = SUM(tblTrades[NetProfit])
I believe my Cummulative Profit DAX measure is correct.
NetProftCum =
CALCULATE( [NetProfit2],
FILTER( ALLSELECTED(‘tblTrades’),
tblTrades[ Exit Order DateTime ] <= MAX( tblTrades[ Exit Order DateTime ] ) ) )
The next step is to calculate the Peak Cum Profit then subtract the current Cum Profit to return the drawdown. I can’t figure out how to efficiently calculate the peak cum profit (called Cum Peak Profit below).
I created this measure to calculate the Max Cum Profit, but it not returning the correct figure and it’s extremely inefficient.
Peak Cum Profit =
MAXX(
FILTER(ALLSELECTED(‘tblTrades’), ‘tblTrades’[ Exit Order DateTime ]<=MAX(‘tblTrades’[ Entry Order DateTime ])),
[NetProftCum])
I think taking a look at the Excel file will help along with seeing the data in PowerBI in a table format to cross reference.