Calculating Drawdown and MaxDrawdown

Hi Everyone,

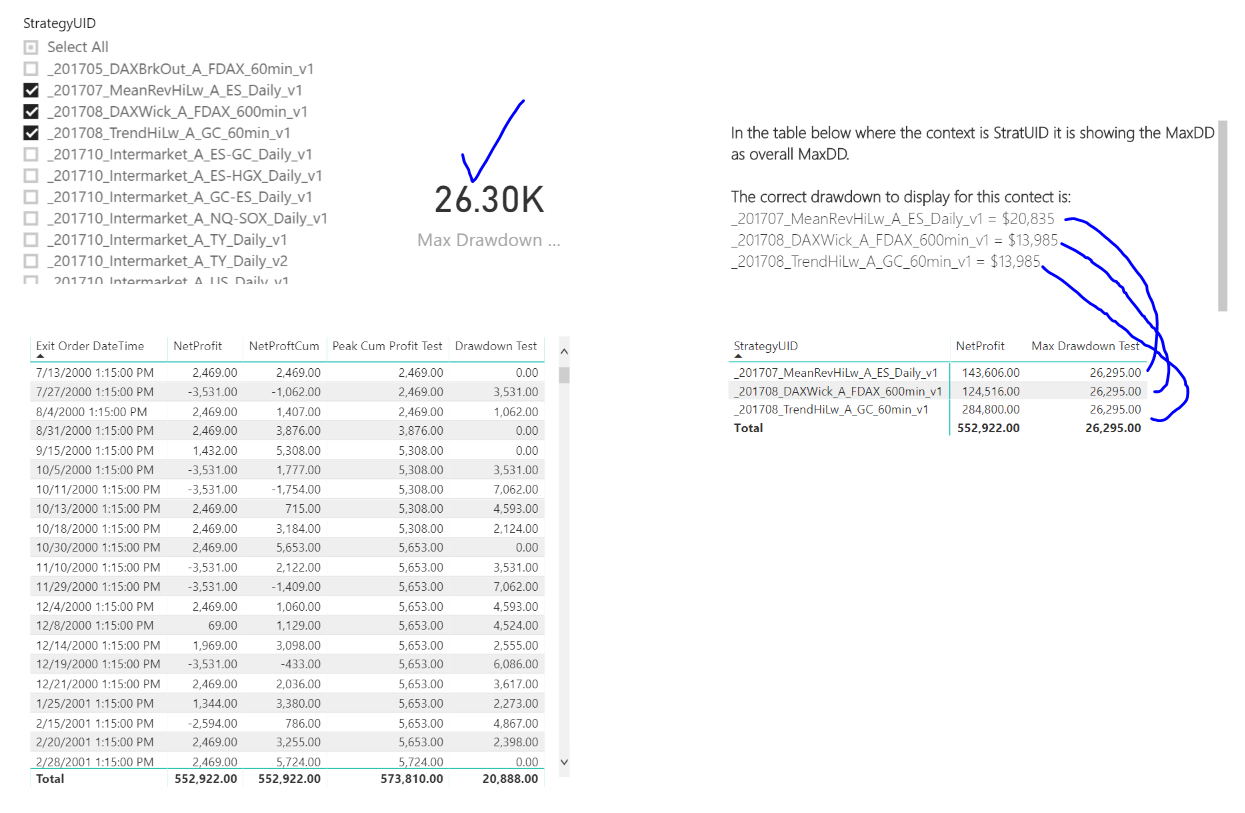
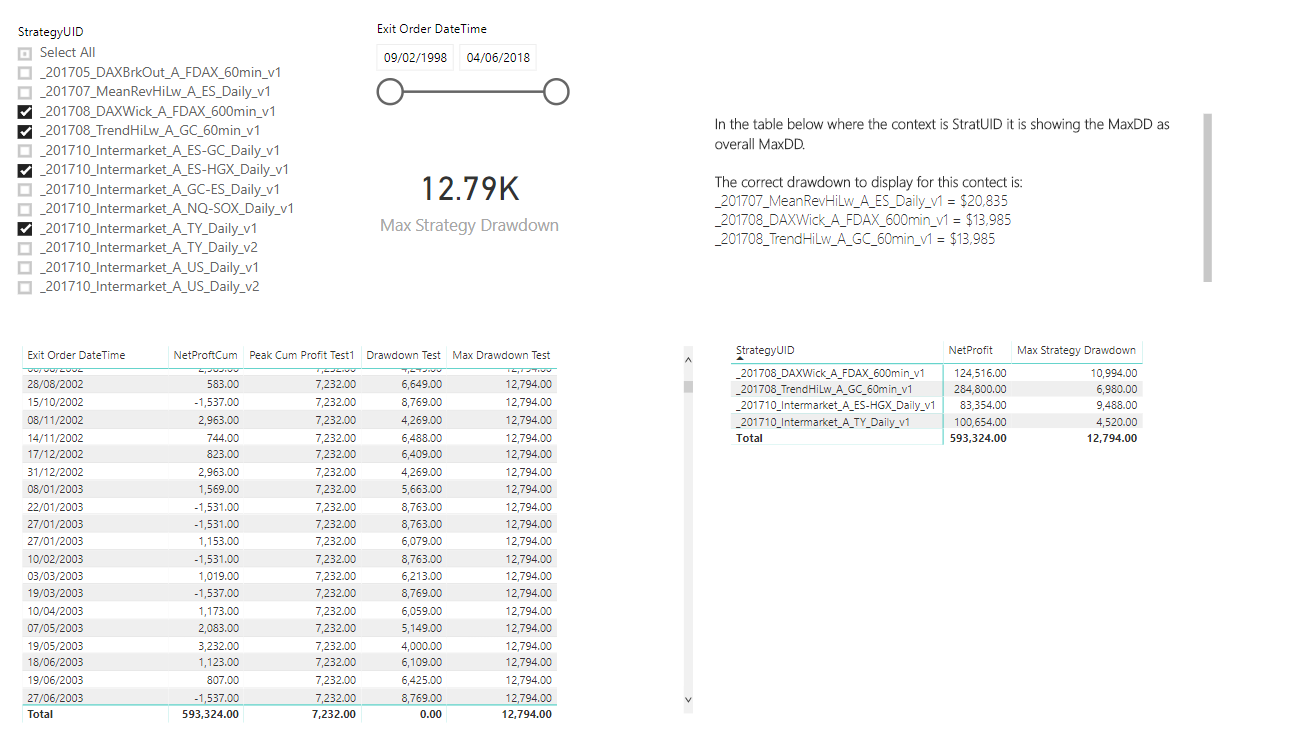
I need help creating an efficient calculation for drawdown and maximum drawdown in an equity curve (which is a cumulative sum of net profit or revenue, etc). A drawdown is a measure of decline in an equity curve from a peak to a trough and the maximum drawdown (MaxDD) is simply the largest drawdown in the equity curve.

This metric is most commonly used in the financial trading/investing industry to calculate the actual or potential risk in trading system or portfolio, but can really be used for anything such as customer revenue, accounts receivables, etc.

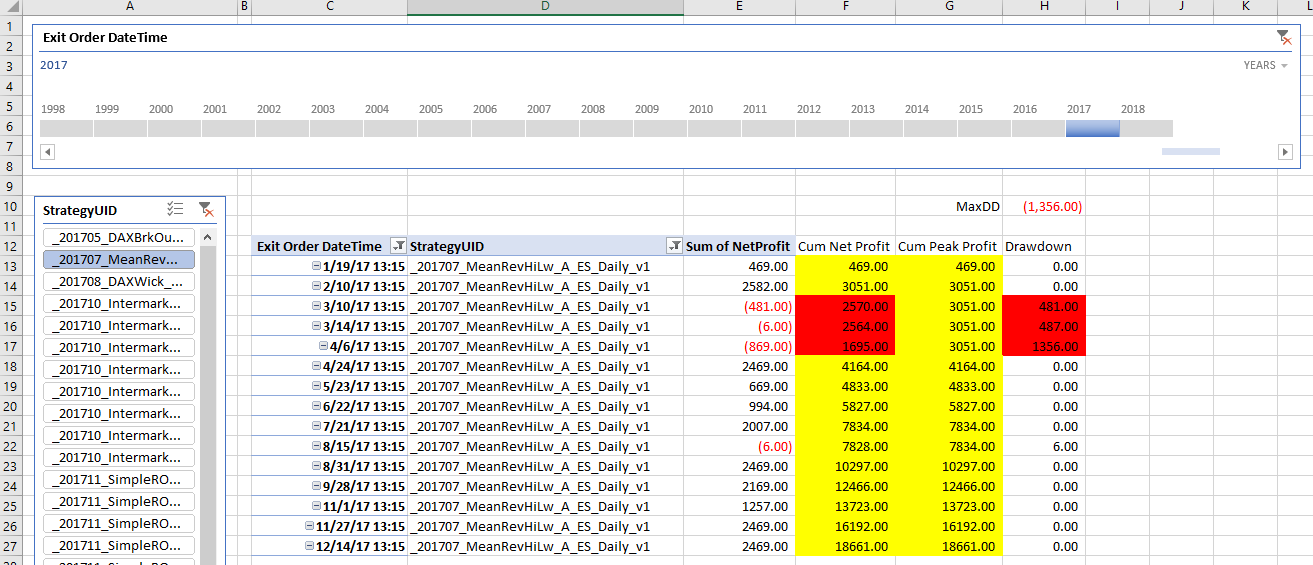
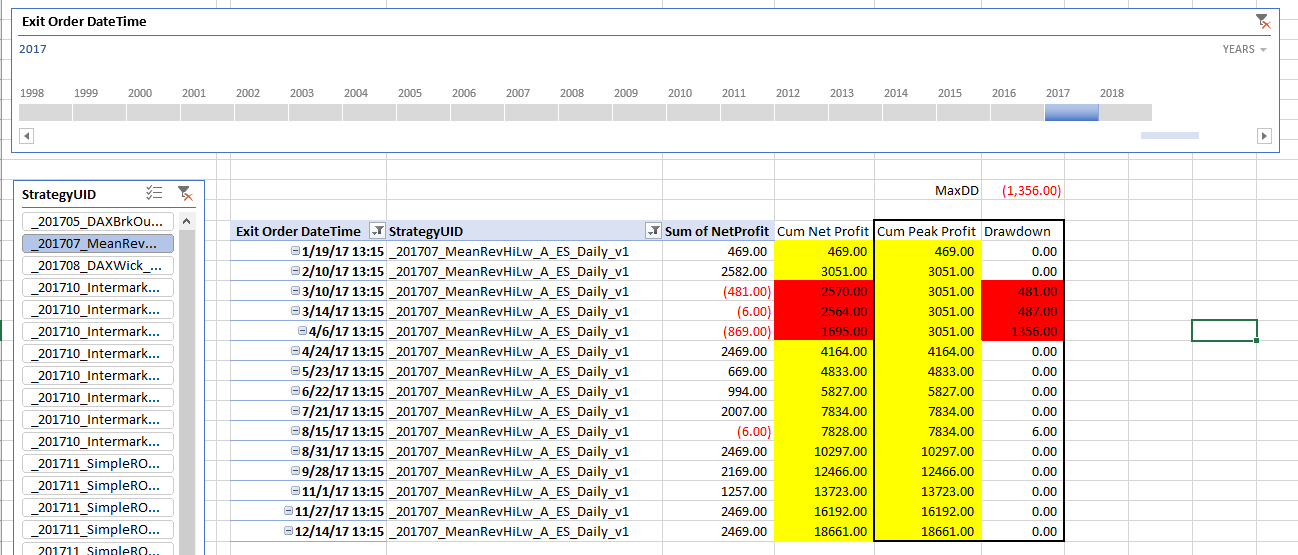
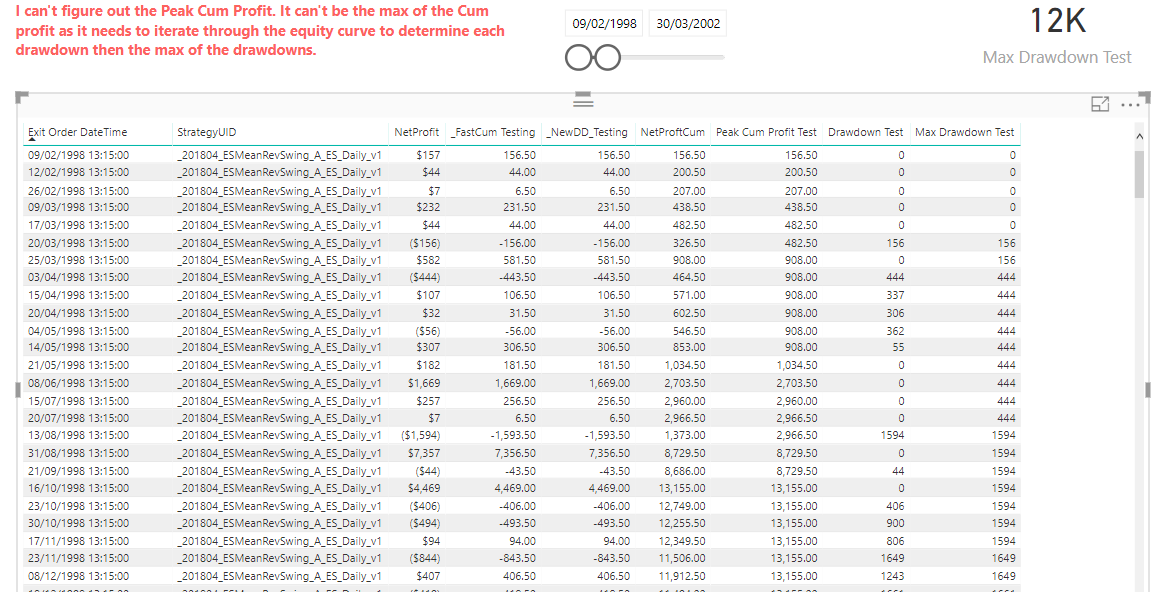
For my dashboard, besides profit this is the most important metric as it represents risk and I can’t figure out an efficient calculation for this! I think the screenshot below provide more clarification on how this is calculated and what this looks like.

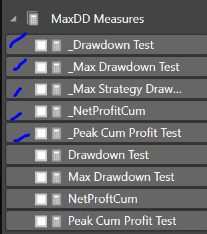
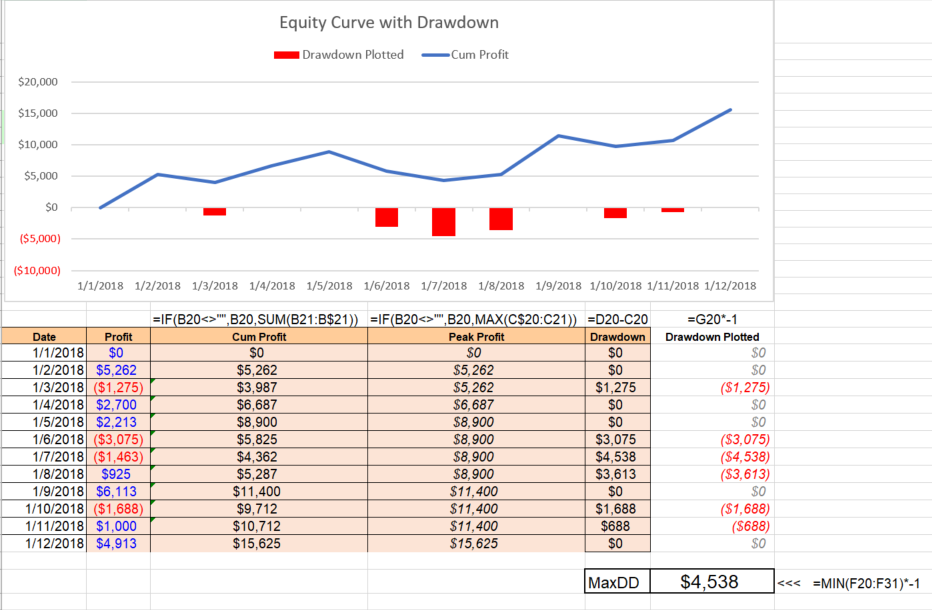
There are essentially 3 main calculations that can be derived from drawdown and then you take the max(or min if drawdown is shown as a negative number) to determine the maximum drawdown.

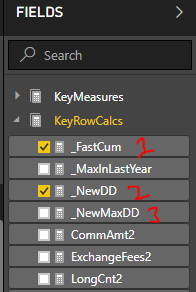
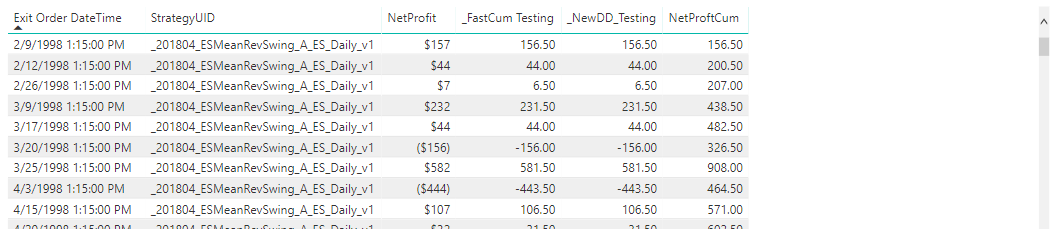
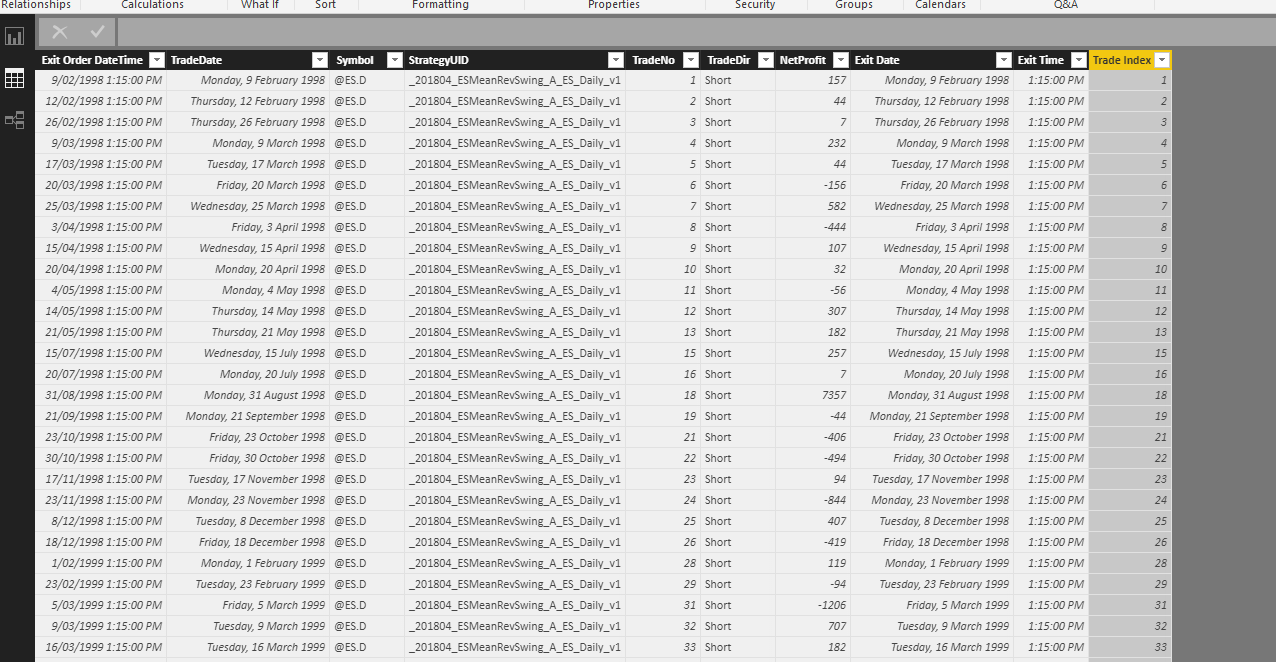
Profit (in the data model table), Cumulative Profit, Peak Profit, Drawdown, maxDD

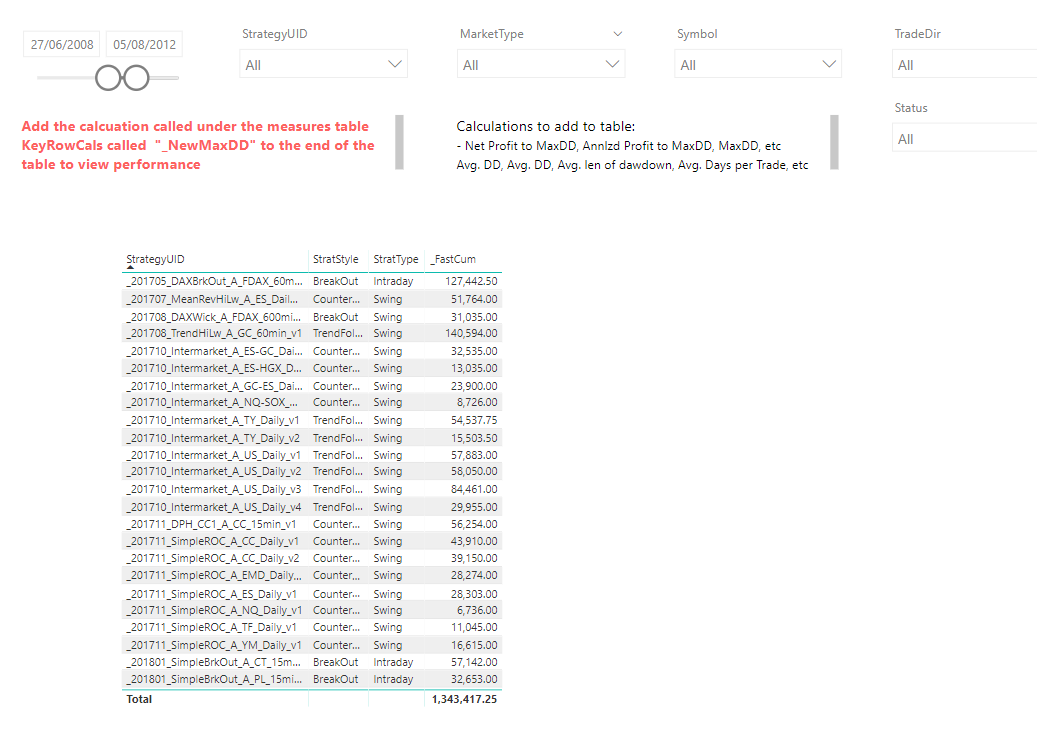
The dashboard has aprox 20K rows of data (which is not a lot of data) and each row represents a trade that has profit, date, system name, type of strategy, etc. I figured out how to return the correct maximum drawdown figure dynamically in the PowerBI dashboard, but is not usable since it is so inefficient so probably best to start over!

Let me know if you need any other information or pbx files. Really appreciate any assistance I can get!

Definitely achievable here.

What’s important though is to understand how you want to showcase this in Power BI.

Have you got some images around the current setup you have and also the current calculations.

If you want to also on top of this share the report I can have a look at it. But some detail with images within this post would also be helpful.

Chrs
Sam

It would be great to see you current formula to understand why it’s so ineffecient.

Also with your drawdown results is this intraday? For example, are we looking at the highest results for any day versus the lowest result/price per day. With the difference being the drawdown?

You should be able to do this with an iterating function like MAXX but I just want to see more.

Thanks

Hey Sam, I’m glad to hear you think it’s achievable! I think I got close, but maybe I over complicated things and missed something important along the way. One thing you might notice is that I’m not using the date table as the way I approached this didn’t help, but made things worse.

Great question, I’m not using intraday drawdown, just Trade Close to Trade Close Drawdown so it simplifies things a bit. It would be great to have both, but it’s not necessary due to the shorter hold times.

Attached is what I have so far showcased in PowerBI. When 1-2 years is selected in the Trade date slider the performance is ok, but when the entire date range is selected it’s extremely slow when you start slicing the data. I made a couple notes in red on the tabs. I didn’t want to further add to the design and other tabs until I got this MaxDD metric down and working efficiently so this is just a working mock up.

The below measures make up the MaxDD.
Net Profit: NetProfit (in tblTrades in the fact table)
Cumulative Profit: _Fast Cum
Max Cum Profit: _NewDD
Drawdown: _NewDD
MaxDrawdown: _NewMaxDD

image

Strategy Performance Dashboard - Beta v1.pbix (2.9 MB)

Ok I’m having a look through. The performance is seriously terrible on the NewDD formula. Will have to make some big changes here.

There’s quite a bit going on, so what I always like to do it really simplify what I’m look at to really drill down into the specific problem I’m working on.

I’ve first created another page with just this table

This NewDD formula is a problem. Far to complex. Need to simplify this as much as possible.

The reason it’s taken so long as you are completing iterations within iterations within interations within iterations. Mostly coming from the use of FILTER and ALL functions. The work that the calculation has to do grows exponentially every iteration. So we need to simplify things big time here.

_NewDD = 
VAR CurrentDate = LASTDATE(tblTrades[TradeDate])
VAR BeginDate = FIRSTDATE(ALLSELECTED(tblTrades[TradeDate]))
VAR PreviousDate = IF(
                        CurrentDate - BeginDate < 365,
                        BeginDate,
                        LASTDATE(FILTER(ALLSELECTED(tblTrades[TradeDate]),tblTrades[TradeDate] <= CurrentDate - 365))
)
VAR CurrentFilter = FILTER(
                        FILTER(
                            ALLSELECTED(tblTrades[TradeDate]),
                            tblTrades[TradeDate] >= PreviousDate
                        ),
                        tblTrades[TradeDate] <= CurrentDate
                    )
VAR VirtualTable =
SUMMARIZE(
    CurrentFilter,
    tblTrades[TradeDate],
    "Cum", CALCULATE(
            SUM(tblTrades[NetProfit]),
            FILTER(
                FILTER(
                    ALL(tblTrades[TradeDate]),
                    tblTrades[TradeDate] <= MAX(tblTrades[TradeDate])
                ),
                tblTrades[TradeDate] >= BeginDate
            )
        )
)
VAR MaxCumProf = MAXX(
                    VirtualTable,
                    [Cum]
                )
VAR CurrentCum = [_FastCum]
RETURN
IF(
    CurrentCum <= MaxCumProf,
    CurrentCum - MaxCumProf,
    BLANK()
)

I’m actually finding it hard to understand why parts of this formula actually exist

VAR CurrentDate = LASTDATE(tblTrades[TradeDate])
VAR BeginDate = FIRSTDATE(ALLSELECTED(tblTrades[TradeDate]))

These two parts I’m not sure are actually doing anything. As the natural context (from the slicer) will create these bounds for you.

For example on this formula, nearly all of it is redundant.

_FastCum = 
VAR CurrentDate = LASTDATE(tblTrades[TradeDate])
VAR BeginDate = FIRSTDATE(ALLSELECTED(tblTrades[TradeDate]))
VAR CurrentFilter = FILTER(
                        FILTER(
                            ALL(tblTrades[TradeDate]),
                            tblTrades[TradeDate] >= BeginDate
                        ),
                        tblTrades[TradeDate] <= CurrentDate
                    )
RETURN
CALCULATE(
    SUM(tblTrades[NetProfit]),
    CurrentFilter
)

I get exactly the same results with just this

_FastCum Testing = SUM(tblTrades[NetProfit])

image

So a really good understanding of evaluation context is required here.

I would say the calculations you currently have are doing 10x the required work for exactly the same answer.

Start here - there’s some good videos to review around this one

http://portal.enterprisedna.co/courses/103686/lectures/1772405

So I’ve been testing a few things, but we might need to iterate through a few things to get this completely correct.

If there any reason why this formula wouldn’t get what is needed. You’ll have to check the numbers for me though

_FastCum Testing = SUM(tblTrades[NetProfit])

_NewDD_Testing = 
MAXX(
    SUMMARIZE( tblTrades, tblTrades[TradeDate] ),
        [_FastCum Testing] )

Here’s the answers

image

Hey Sam, thanks for all of the detail you provided. I hope I can do a better job explaining this metric.

Attached is an updated PowerBI file. I created a new group of measures for the DAX you provided and added what I believe is the correct CumNetProfit to keep things clean. I also created a new tab to see and validate the data called MaxDD Testing.
Strategy Performance Dashboard - Beta v3.pbix (2.5 MB)

imageStrategy Performance Dashboard - Beta v3.pbix (2.5 MB)

I’m attaching an example of this dataset in excel with the correct Max Drawdown.
MaxDD in Excel using the Same Dataset.xlsx (1.6 MB)

A drawdown is when the cumulative net profit is less than the prior peak cumulative profit so cumulative profit can’t be aggregated as it needs to calculate each drawdown in the equity curve then take the max. Below is an example of what this looks like in the data. The columns in red are drawdowns, because the cumulative profit is less than the prior peak in cumulative profit.

The cumulative profit you have called _FastCum won’t work because it’s just an aggregated Net Profit.

_FastCum Testing = SUM(tblTrades[NetProfit])

I believe my Cummulative Profit DAX measure is correct.

NetProftCum =
CALCULATE( [NetProfit2],
FILTER( ALLSELECTED(‘tblTrades’),
tblTrades[ Exit Order DateTime ] <= MAX( tblTrades[ Exit Order DateTime ] ) ) )

The next step is to calculate the Peak Cum Profit then subtract the current Cum Profit to return the drawdown. I can’t figure out how to efficiently calculate the peak cum profit (called Cum Peak Profit below).

I created this measure to calculate the Max Cum Profit, but it not returning the correct figure and it’s extremely inefficient.

Peak Cum Profit =
MAXX(
FILTER(ALLSELECTED(‘tblTrades’), ‘tblTrades’[ Exit Order DateTime ]<=MAX(‘tblTrades’[ Entry Order DateTime ])),
[NetProftCum])

I think taking a look at the Excel file will help along with seeing the data in PowerBI in a table format to cross reference.

Ok great.

So what I always look to do it recreate as much of the table in excel within Power BI as I can. This way I can actually see the numbers and then attempt to recreate them in the next ‘context’ that you are looking to calculate them in.

I agree the NetProfitCum looks good and is using the correct combination.

Now we have to work out Peak Cumulative Profit…this should get you what you need here in an efficient way

Peak Cum Profit Test = 
VAR CurrentDate = MAX( tblTrades[ Exit Order DateTime ] )

RETURN
MAXX( 
    FILTER(
        SUMMARIZE( ALLSELECTED( tblTrades ), tblTrades[ Exit Order DateTime ],
            "CumulativeProfit", [NetProftCum] ),
                tblTrades[ Exit Order DateTime ] <= CurrentDate ),
    [CumulativeProfit] )

Then from here we can get the drawdown

Drawdown Test = 
IF( [NetProftCum] < [Peak Cum Profit Test], [Peak Cum Profit Test] - [NetProftCum], 0 )

Then max drawdown using a similar technique/pattern to above

Max Drawdown Test = 
VAR CurrentDate = MAX( tblTrades[ Exit Order DateTime ] )

RETURN
MAXX( 
    FILTER(
        SUMMARIZE( ALLSELECTED( tblTrades ), tblTrades[ Exit Order DateTime ],
            "MaxDrawdown", [Drawdown Test] ),
                tblTrades[ Exit Order DateTime ] <= CurrentDate ),
    [MaxDrawdown] )

Here’s are the answers I’m getting which seem to line up pretty close.

I had to shorter the time frame because the model performance on longer term time frames is still slow.

The model itself overall is running very slow. This may not be preferred but my advice is to start in a brand new model here and copy over all these new formulas. What happens sometimes I find when you have had historic formula that have taken a huge amount of time to calculate, they have a lasting impact on your model. In my view this is definitely the case here, as the model still have quite poor calculation times and my laptop is slowing right down which is never a good sign. I’m presuming you’re having the same problems.

This calculation here on the whole are not intensive, so this is just my recommendation.

Also another thing to review here is virtual tables.

This ties in with the solutions I’ve found.

Here’s tutorials where I runs through these.

Thanks Sam. The good news is the formulas and maxDD numbers are correct which is great and is so much more simple than the way I was doing this before! The performance is really really slow as you stated and what I’ve been experiencing with these formulas in PowerBI. I created a new model from scratch with as limited information as possible and it didn’t speed up the performance.

Attached is the new model with only the necessary data for this exercise.

MaxDD Test.pbix (555.7 KB)

Here are my questions.

  1. Is there anyway to optimize these formulas or use a more advanced technique? I’m only able to select a few StratUIDs at a time or very tight date window. The model is unsable if I can’t see all of the data and slice quickly.

  2. The next step is to see the MaxDD in different context such as StratUID in the table below. I changed the context by using the calculate function, but haven’t been able to return the correct figure and it’s also really slow so it’s difficult to test.

Progress is definetly being made so I appreciate it!

I’ve worked on many variations for a quite some time and think I’ve improved performance quite a bit. It seems the ALLSELECTED within the iteration is what was really causing the issues, So I’ve change things up quite a bit.

I’m interesting if these improve your model, so test them out.

Here’s the revised formulas to use

NetProftCum = SUM( tblTrades[NetProfit] )

Peak Cum Profit Test1 = 
VAR CurrentDate = MAX( tblTrades[ Exit Order DateTime ] )
VAR StartDate = CALCULATE( MIN( tblTrades[ Exit Order DateTime ] ), ALLSELECTED( tblTrades[ Exit Order DateTime ] ) )

RETURN
MAXX( 
    CALCULATETABLE( ALL( tblTrades[ Exit Order DateTime ] ),
                tblTrades[ Exit Order DateTime ] >= StartDate && tblTrades[ Exit Order DateTime ] <= CurrentDate ),
    [NetProftCum] )


Drawdown Test = 
IF( [NetProftCum] < [Peak Cum Profit Test1], [Peak Cum Profit Test1] - [NetProftCum], 0 )


Max Drawdown Test = 
VAR CurrentDate = MAX( tblTrades[ Exit Order DateTime ] )
VAR StartDate = CALCULATE( MIN( tblTrades[ Exit Order DateTime ] ), ALLSELECTED( tblTrades[ Exit Order DateTime ] ) )

RETURN
MAXX( 
   CALCULATETABLE( ALL( tblTrades[ Exit Order DateTime ] ),
         tblTrades[ Exit Order DateTime ] >= StartDate && tblTrades[ Exit Order DateTime ] <= CurrentDate ),
    IF( [NetProftCum] < [Peak Cum Profit Test1], [Peak Cum Profit Test1] - [NetProftCum], 0 ) )

Then for max strategy drawdown, try this (I’m not 100% sure this is right, but it the correct idea for the formula)

As there’s no date context here, we don’t need to remove and then add it back in like the other formulas, so it should be easier to compute overall.

Max Strategy Drawdown = 
MAXX( 
    VALUES( tblTrades[ Exit Order DateTime ] ),
        [Drawdown Test] )

Here some results in a report

These formulas have made a huge difference to performance so see how they go on yours.

Hey Chris, so the formulas are way way faster, but unfortunetly they aren’t accurate :confused:

I added the new fast formulas and differntiated them from the slow (but correct formulas) by adding a “_” in front of the measures.

MaxDD Test.pbix (566.4 KB)

image

You can see the overall MaxDD is way off for just these 3 selected strategies. The correct MaxDD is 26.3K.

I was trying to tweak the new fast formulas to achieve the correct MaxDD, but still no luck. Are there any other options you can think of to achieve the results on the left table, but better performance? I’ve been at this for a few months so I’m glad in some ways it wasn’t a quick fix! I feel like we’re really close though!

Sorry that’s my error…I can see the problem. I’ll have to complete some more testing

No worries! Sounds good.

I’m am still working on this and thinking about it. Just haven’t found a perfect solution yet. It’s proving a tough one. I’ll come back as soon as I can with something.

Ok wanted to show you progress so far as have spent a serious amount of time on this.

I’ve basically had to rethink this a couple of times.

I’ve attached the model here as I’ve made changes to the tables, model and formulas to make it all work more effeciently.

I think there has been some progress but you’ll have to test is on your side.
MaxDD Test (1).pbix (682.4 KB)

Let me know what you think about all the adjustments.

I also recreate the table so I could actually use the query editor. I add a few things to it.

Been reviewing again today.

It definitely faster than what it was, but probably not fast enough when looking at really long time frames

It’s a work in progress still.

Let me know what you think of the changes.

Hey Sam, on my end it’s really really slow still. It actually won’t run at all on some strategies for the entire time period whereas the prior version it would. The latest formulas are definitely much easier to follow! Thanks for not giving up on this! I still believe there has to be a way :slight_smile:

I been consulting with a friend of mine Owen Auger on this to get a different perspective. And he’s come up with another idea that I think does work pretty well and see to come up with correct results.

Have a look over this and see what you think.

Calculations are definitely faster but want to make sure it’s producing it the right way.

MaxDD Test (1) OWEN.pbix (1.0 MB)

Using the Exit Order Date and time I believe has been a problem here.

Could you use date? or Exit date? instead of the column with time also?