Hello,
I am trying to create a table with a couple of measures coming from two different tables. I have set up active relationship among the two tables as well as inactive relationships between the dates columns. However, I might be doing something incorrectly here due to which my numbers are not coming in correctly. Please let me know what I might be doing wrong. I am still pretty new to BI and thus, this may be pretty easy and I might be doing it incorrectly here. Any help would be very much appreciated. I am attaching the file below here.
eDNA_calculatedtable.pbix (102.1 KB)
Thank you
Hi @supergallagher25, we aim to consistently improve the topics being posted on the forum to help you in getting a strong solution faster. While waiting for a response, here are some tips so you can get the most out of the forum and other Enterprise DNA resources.
-
Use the forum search to discover if your query has been asked before by another member.
-
When posting a topic with formula make sure that it is correctly formatted to preformated text </>.
-
Use the proper category that best describes your topic
-
Provide as much context to a question as possible.
-
Include demo pbix file, images of the entire scenario you are dealing with, screenshot of the data model, details of how you want to visualize a result, and any other supporting links and details.
I also suggest that you check the forum guideline https://forum.enterprisedna.co/t/how-to-use-the-enterprise-dna-support-forum/3951. Not adhering to it may sometimes cause delay in getting an answer.
Hi @supergallagher25,
Could you please elaborate on what exactly you are trying to show in your table?
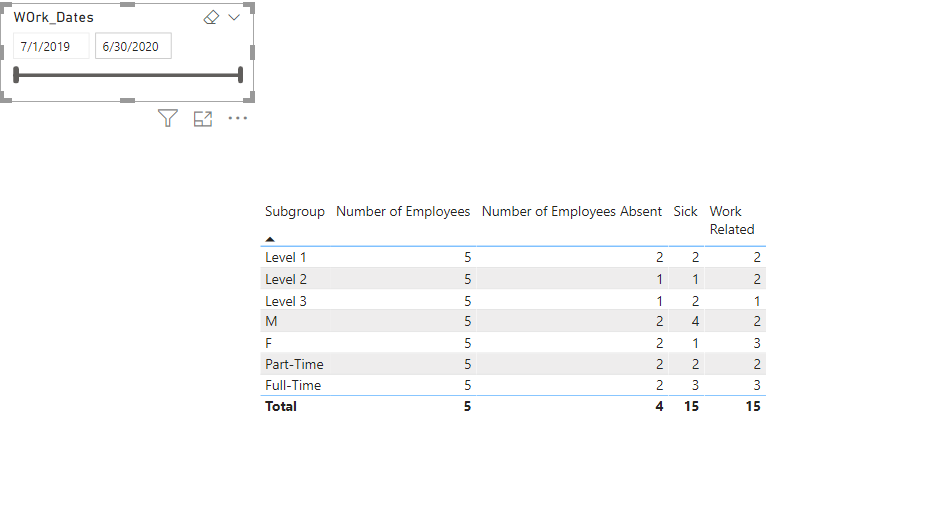
From the table created in your report, what I understand is that you are trying to show Number of employees, number of absentees etc. within a particular date range.
Just a quick question, what if an employee joined and left within the selected range? What should the table show?
Best Regards
Simran Tuli
Hello,
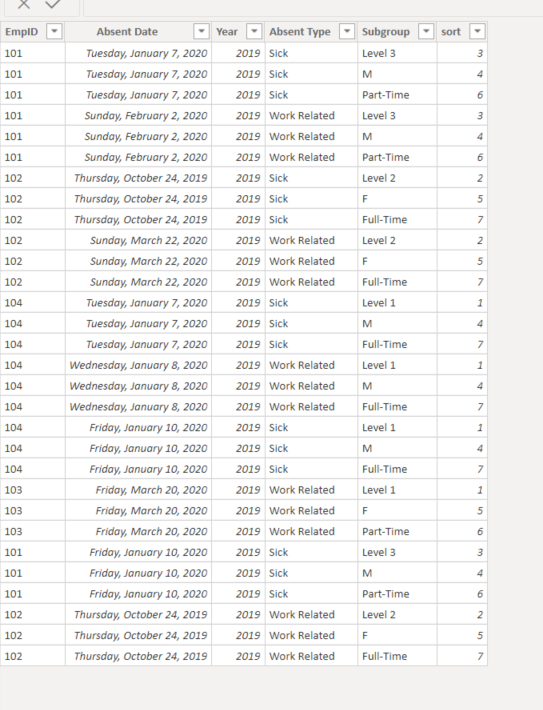
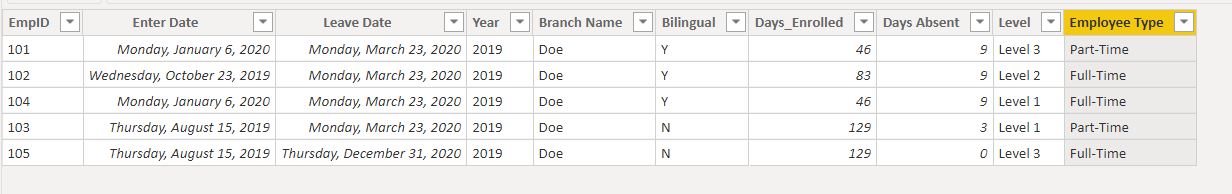
I have three tables,
- t_Calendar which consists of dates
- tEmployee
*t_absent
For the t_absent table, I did an unpivot on the “Level”,“Gender”,“Employee Type”.
This is where things gets tricky afterwards. And I do not know if this part if possible without having to do an unpivot in the tEmployee table. But I am hoping that there is a way and I am not thinking through.
My Subgroup column fromes from the t_absent table where as the number of employees is a mesure that is calculating it from the tEMployee table. I have both the tEmployee and the t_absent table connected in an inactive relationship with the t_Calendar which is also not working as planned.
Hello @supergallagher25,
You have mentioned that the tables are having an inactive relationship. Well, that won’t work as we need to have an active relationship between the tables to flow the values.
Or you can use the USERELATIONSHIP function to define the relationship which is inactive to make it active in the calculation of that particular measure. This will help you in activating the relationship. Please refer below document link.
Please have a look and let me know if this works or not.
Thanks
Shubham
I do have active relationships between the tables. It is just inactive with the calendar table. However, regardless of the date table, how do I bring int he count of IDs based on the unpivot column as shows above from a normal table?
Hello @supergallagher25,
Can you please share a sample file so that I can check your relationships?
Basically, as per my understanding, you want a table that shows the total number of employees of different subgroups along with the number of absentees. Please let me know if you need to have something else as well. I will try to fix your sample file accordingly.
Thanks
Shubham
Yes, the subgroup column comes from the absent table and the number of employees comes from the employee table. I had uploaded the file with the post in the beginning.
I am attaching it again here. Thank you for your time and consideration.eDNA_calculatedtable.pbix (102.1 KB)
Hello @supergallagher25,
Thanks for sharing the files. I have fixed the measures that are not involving the date table.
As you want it to work in general. Please have a look and let me know if these are the values you want in total.
eDNA_calculatedtable.pbix (99.9 KB)
If you want to fix the inactive thing then we need to use the USERELATIONSHIP function to define the relationships
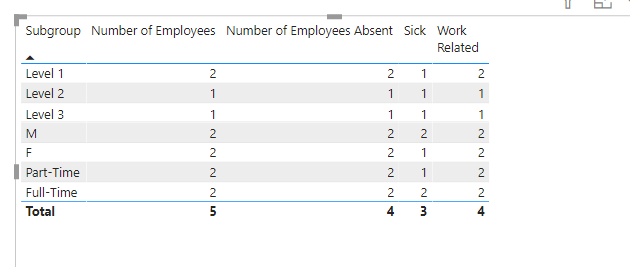
Thank you so much for the help, the number of employees is incorrect since it is showing count of Part-Time to be 2 as well as Full-Time as 2 which is equal to 4 where as we have 5 employees overall and the table actually should show 3 full-time.
Hi @supergallagher25,
Please refer below image.
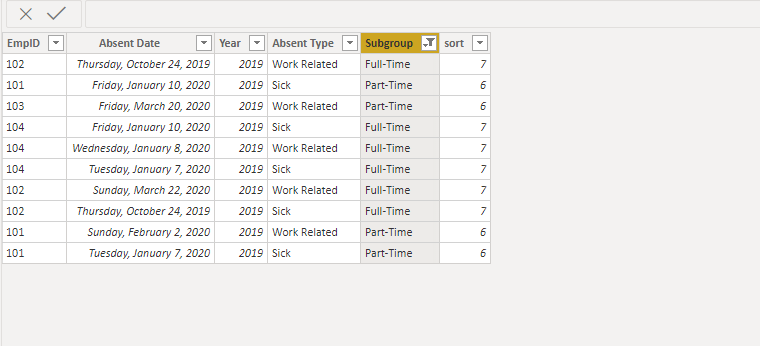
If you check this it has only 4 distinct EMP ID and that is why it is showing 2 and 2. While the total is 5.
Can you share the updated file from which you have shared the screenshot?
Or you can just fix the relationship to Both cross filtration and the measures like I did in the shared file.
I do not have an updated file. I was showing it from the one that you had just uploaded. My screen shot for the 5 employee is from the Employee table. I am trying to see if there is a way we can show 5 in the total number of employees.
Hi @supergallagher25,
If you see my total number for employees, it is 5 only but if you check it based on subgroup then it is showing up the values.
The screenshots I shared is from the same file and I have only 4 unique EmpID for full time and part time and that’s why it is showing 2 and 2.
Hello,
I apologize for the late reply, that table that you were showing earlier would only be showing 4 employees because only 4 were absent out of the 5 employees which is where I have been struggling to bring in all 5 employees in the visual since the subgroup column comes from the absent table.
Hello @supergallagher25,
Well if the subgroup is only showing 4 empid then how we can add a subgroup to the 5th one.
Can’t we have a subgroup in the main table that has all the empid. Because if the group doesn’t take in account the 5th one then we can’t associate the same with the group coming from the supporting/related table.
Hi @supergallagher25, a response on this post has been tagged as “Solution”. If you have a follow question or concern related to this topic, please remove the Solution tag first by clicking the three dots beside Reply and then untick the check box. Also, we’ve recently launched the Enterprise DNA Forum User Experience Survey, please feel free to answer it and give your insights on how we can further improve the Support forum. Thanks!