Calculated calculated column to show EOM

Hi All,

I want to create a column in my date table that will show “EOM” relating to my date column. I do not have a standard date table. My fiscal year starts in July, but sometimes FY week 1 is in June. Therefore I need my EOM to be the last fiscal week in June.

I need to get a total of the last week sales in every month, so I use:

CALCULATE([TotalSales], ‘Date Table’[EOMLogic]=“EOM”)

where EOMLogic is (calculated column):
IF(ENDOFMONTH(‘Date Table’[Wk Beginning])=‘Date Table’[Wk Beginning], “EOM”, BLANK())

However, EOMLogig will not work for June.

Does anyone have any solutions?
Sample PBIX Microsoft.pbix (1.4 MB)

Hi @Nurry90,

Thanks for providing a sample file :+1:
Can you see if this meets your requirement.

EOMLogic = 
VAR cPeriod = 'Date Table'[Fiscal Month & FY]
RETURN

IF( 'Date Table'[Fiscal Month] <> "June",
    IF(ENDOFMONTH('Date Table'[Wk Beginning])='Date Table'[Wk Beginning], "EOM" ),
    IF( MAXX( FILTER('Date Table', 'Date Table'[Fiscal Month & FY] = cPeriod ), [FinYear & FYweek] ) = 'Date Table'[FinYear & FYweek], "EOM")
) 

I hope this is helpful.

Hi @Melissa ,

That does work for my calculation when I have Fiscal Month as the context, which is great. Thank you :smiley:

However “EOM” in the calculated column is still showing against Fiscal week 1, which I do not want to show. Is there any way we can stop this?

Also, I need my calculation to show a rolling 12 months. E.g. If I select April 2020 as a filter, I need to get a total of the last week sales in the 12 months previous, (April 2019-April2020). Is there any way I can adjust my above calculation to make it more dynamic?

Thanks for your help :smiley:

I don’t understand this. It’s a calculated column inside the Date table, so there will always be context from the Fiscal Month…

.

@Nurry90,

To help this move along more quickly please supply a mock up of expected results in excel
And do the tables in your PBIX reflect how you want to visualize the results?

Thank you!

Hi @Melissa,

I will have to work on another file and get back to you. For now, please see attached updated pbix.

I have a filter on July, you can see that week 1 is included in the total for the EOM. I know the Wk Beginning date is technically the EOM, but in this instance I need week 6 (for 2018) to be the EOM. (FY Week 1 is the “Start of Month”, so FY week 1 should not = EOM in calculated column). Sorry, I hope this makes more sense.

Sample PBIX Microsoft (1).pbix (1.4 MB)

Hi @Nurry90,

The correction now applies to both June and July, please see if this is what you are after.

EOMLogic = 
VAR cPeriod = 'Date Table'[Fiscal Month & FY]
RETURN

IF( NOT('Date Table'[Fiscal Month]) IN { "June", "July"},
    IF(ENDOFMONTH('Date Table'[Wk Beginning])='Date Table'[Wk Beginning], "EOM" ),
    IF( MAXX( FILTER('Date Table', 'Date Table'[Fiscal Month & FY] = cPeriod && 'Date Table'[FY Week number] <>1 ), [FinYear & FYweek] ) = 'Date Table'[FinYear & FYweek], "EOM")
)

I hope this is helpful.

Hi @Melissa,

Thank you for sending that through. It seems to be working great :smiley:

Just on the measures for rolling 12, and rolling 2 months’ EOM sales. I have attached an excel of what I need with the formulas included to hopefully help my terrible explanation.

I not have an EOM sales (which is the last weeks sales in that month). I want to add together the previous 12 months EOM sales.

Hope you can help!

R12.xlsx (12.5 KB)

Hi @Nurry90,

Thanks this is very helpful !

However before I move on - the results for the periods below don’t line up, can you explain what should be happening? First 2 columns were supplied by you, last 2 are results based on the EOMLogic from post #6

Fiscal Month & FY Sales EOM Total PBI Measure WK Beginning
July - FY2019 $32.341.316,12 $16.170.848,06 30-07-18
July - FY2021 $32.409.621,52 $16.209.559,06 27-07-20
July - FY2022 $32.324.723,80 $16.163.946,70 26-07-21

Hi @Melissa,

I think the “Sales EOM Total” in the screenshot is from the original calculation you provided me. The file has not been updated since. Is that what you mean? Although EOM FY2020 is missing from yours. Is that another filter?

Sample PBIX Microsoft (1).pbix (1.4 MB)

EOM FY2020 is missing because that is the only time the figures match your expected result :wink:

See list below, I need to understand why the results don’t match for the marked periods, that’s also why I supplied the Week Beginning date, hoping that will allow you to provide a quick answer…

Thanks again!

Hi @Melissa,

Completely my fault. The sample data that I provided you was based on the original " Sales EOM Total" calculation. Please see attached updated excel file.

Hopefully that makes more sense :smiley:

2 sample data previous 12 months and 2 months…xlsx (12.4 KB)

Thanks for this! Results now match. :+1:
I’ll get started on the rolling 12 and rolling 2 months’ EOM sales

1 Like

Hi @Nurry90,

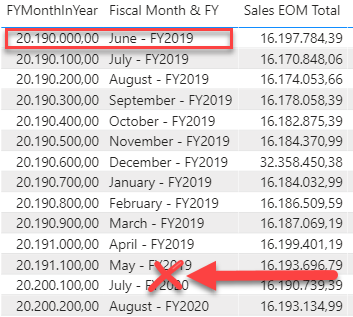
There seems to be an issue with your Date table that you’ll need to look into and fix. Your FY start month is July but June 2019 is now seen BEFORE July 2019 and not AFTER May 2019.

image

Nevertheless I worked around that by creating a custom index for your EOM logic. By adding this Calculated Column to your Date table.

EOM ID = 
VAR cFYFW = 'Date Table'[FYWeeknYear]
VAR vTableA = 
    FILTER( 
        ALL('Date Table'[FYWeeknYear], 'Date Table'[EOMLogic] ),
            'Date Table'[FYWeeknYear] <= cFYFW &&
            'Date Table'[EOMLogic] <> "EOM"
    )
VAR vTableB = 
    FILTER( 
        ALL('Date Table'[FYWeeknYear], 'Date Table'[EOMLogic] ),
            'Date Table'[FYWeeknYear] <= cFYFW &&
            'Date Table'[EOMLogic] = "EOM"
    )
VAR vTable = DISTINCT( EXCEPT( vTableB, vTableA ))
RETURN

IF( 'Date Table'[EOMLogic] = "EOM",
    COUNTROWS( vTable )
)

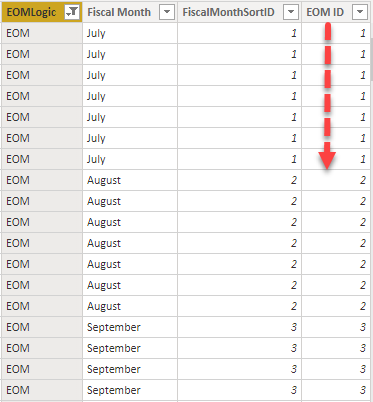
Which then looks something like this in your Date table.

image

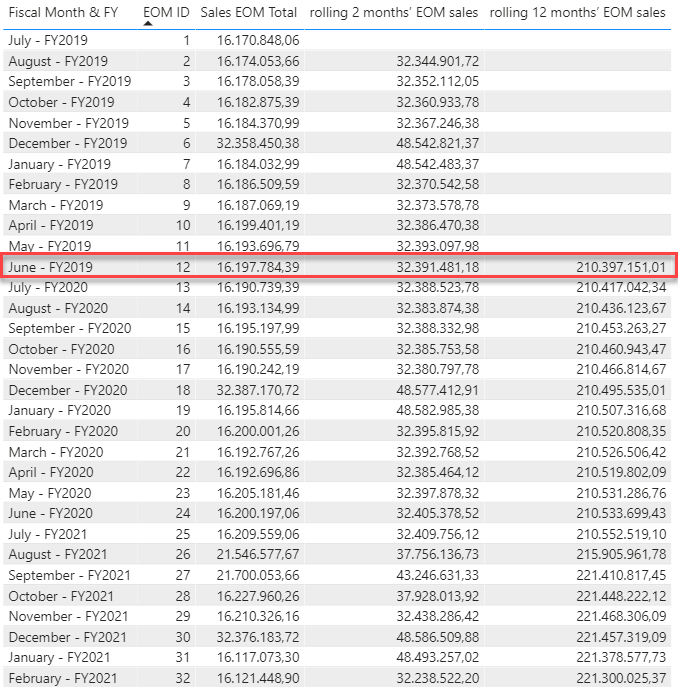
With that in place created this measure pattern for Rolling months

rolling 12 months’ EOM sales = 
VAR curEOM = MAX( 'Date Table'[EOM ID] )
VAR prevEOM = 
    SELECTCOLUMNS(
        ADDCOLUMNS( VALUES( 'Date Table'[EOM ID] ),
            "@PrevID", CALCULATE( MAX( 'Date Table'[EOM ID] ),
                FILTER( ALL( 'Date Table' ),
                    'Date Table'[EOM ID] = EARLIER( 'Date Table'[EOM ID] )-11
                )
            )
        ), "IDs", [@PrevID]
    )
VAR firstEOM = MINX( prevEOM, [IDs] )
VAR Result = 
SWITCH( TRUE(),
    firstEOM <0 || firstEOM = BLANK(), BLANK(),
    SUMX( 
        FILTER( ALL( 'Date Table' ), 
            'Date Table'[EOM ID] IN GENERATESERIES( firstEOM, curEOM, 1 ) 
        ), [TotalSales] 
    )
)
RETURN
    Result

With this result, also notice the correct placement of June - FY 2019 when the [EOM ID] is added.

Here’s your sample file: eDDNA - Custom EOM logic with Rolling months.pbix (1.4 MB)
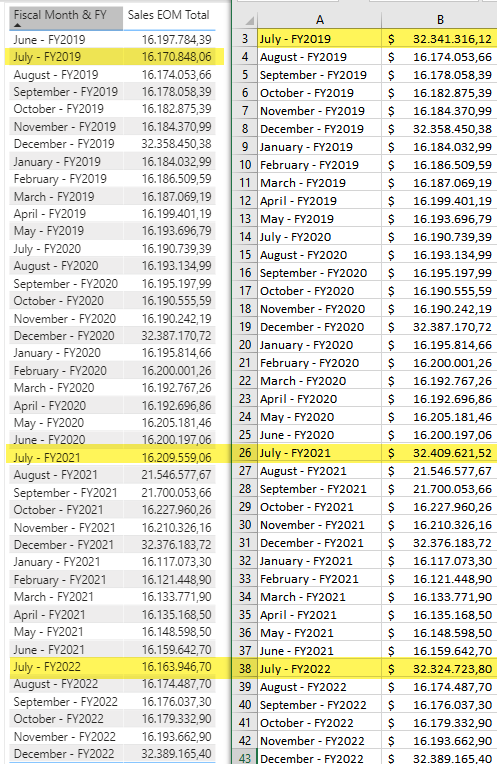
and updated check. Corr prev 12 and 2 months.xlsx (15.9 KB)

Note that if you need further assistance correcting the error in the Date table, to create a new topic.
I hope this is helpful.

2 Likes

Hi @Nurry90, did the response provided by @Melissa help you solve your query? If not, how far did you get and what kind of help you need further? If yes, kindly mark the thread as solved. Thanks!

Hello,

Is it possible to add the same logic into the M Code extended table? It could be something similar to the holidays, where we could reference each fiscal month and year, with it’s corresponding EOM?

To have cut offs for fiscal year, month and weeks, based off the EOM date.

Nevertheless I worked around that by creating a custom index for your EOM logic. By adding this Calculated Column to your Date table.