First, thanks for providing a clear statement of the problem plus all the needed files - makes it much easier to provide good support.
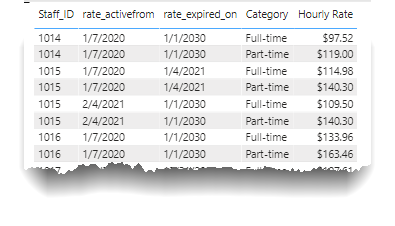
Significant initial prep required before writing DAX. Your fields were all text fields, so needed to be reset to the proper type. Then for the Rate table, I unpivoted the data to get to the following structure, which was better suited to the DAX that would be needed:
Once that was done, I added a calculated column to the Hours Worked table to designate Part-Time or Full-Time (note: I wasn’t sure what to do with employees who were at exactly 80% worked. I called that full-time, but if that’s incorrect it’s easy to change that formula from >= to 0.8 to > 0.8.) I debated using a measure for this, but opted for a calculated column because I thought you might want to slice on that field or use it as an axis or legend in a visual.
After that, here’s the rate lookup measure, which just filters the pivoted data down to one row, based on employee ID, category (full or part-time) and date, and then extracts the rate from that single row table variable.
Rate Lookup =

VAR SelStaff = SELECTEDVALUE( Hours_Worked[Staff ID] )
VAR SelCat = SELECTEDVALUE( Hours_Worked[Category] )
VAR SelDate = SELECTEDVALUE( Hours_Worked[WeekEndingFriday] )

VAR FindRow =
FILTER(
    ALL( Rate_Data ),
    Rate_Data[Staff_ID] = SelStaff &&
    Rate_Data[Category] = SelCat &&
    Rate_Data[rate_activefrom] <= SelDate &&
    Rate_Data[rate_expired_on] >= SelDate
)

VAR Result =
MAXX( FindRow, Rate_Data[Hourly Rate] )

RETURN Result
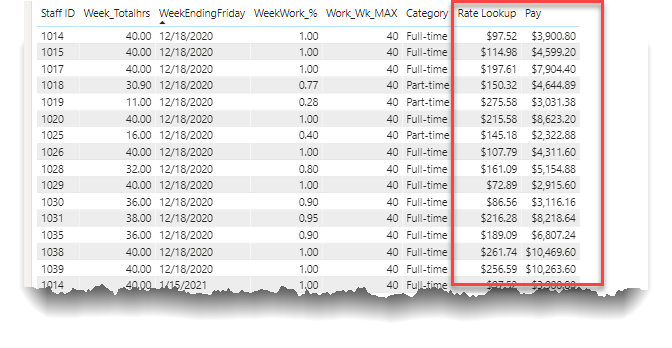
Finally, the Pay measure just multiplies hours worked by the result of the rate lookup measure above. Here’s what it looks like all put together:
Fun problem. I hope this is helpful. Full solution file below.
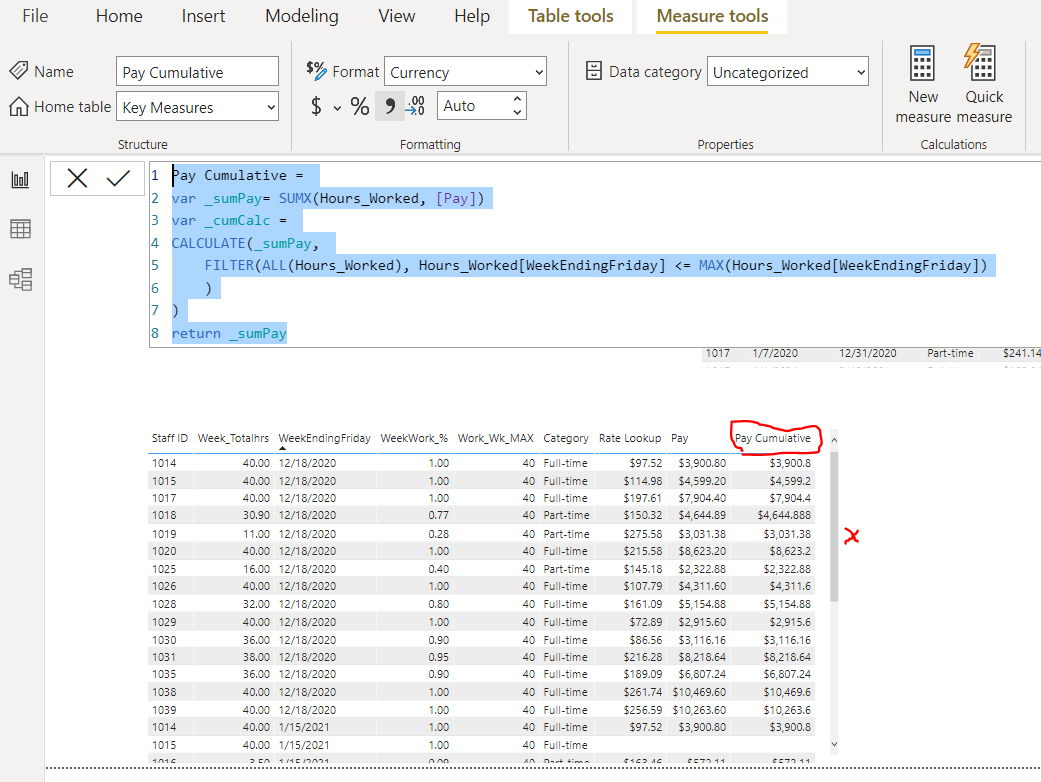
I’m not used to working with measures like this. How can I output a cumulative sum of Pay over time?
My attempted cumulative dax measure below outputs same Pay values. I’ve tried changing filter table context to ALL and ALLSELECTED but none make correct cumulative sums.
Pay Cumulative =
var _sumPay= SUMX(Hours_Worked, [Pay])
var _cumCalc =
CALCULATE(_sumPay,
FILTER(Hours_Worked, Hours_Worked[WeekEndingFriday] <= MAX(Hours_Worked[WeekEndingFriday])
)
)
return _sumPay
Glad the solution worked well for you, and happy to help you on this next question but have one favor to ask.
Typically once a thread is solved, if you’re asking a question that is substantively different than the original one as is the case here, it’s best to start a new thread/topic. This way those of us who respond to questions on the forum can easily track which ones are still open and not lose sight of those that are tacked on to closed threads.