Calculate team head performance

Hi All,

This issue is related / same as one I raised a while back, but still unsolved:

https://forum.enterprisedna.co/t/calculating-dept-head-performance-based-on-direct-report-performance/3770?u=bare

The challenge is to calculate Dept head & total performance as depicted in the attached excel prototype file

overview of prototype.xlsx (13.7 KB)

The prototype shows employees and their reporting line. For each employee we want to obtain the total performance. Total performance is a weighted average of individual & team performance. If an employee does not manage a team, team performance will be null. The absence of a team weight indicates this (there is a dept head table with team weight in the model).

If employee manages a team, then team performance is a weighted average of the total performance of each employee reporting directly to the team manager (as shown in the excel prototype).

So basically, when I select an employee (or logged in with RLS), employee should see his / her individual, team & total performances as visual cards.

I was able to do the standard measures: total weights & individual score (see attached pbi file below)

Emp Dashboard.pbix (143.3 KB)

I implemented row level security but I doubt this should have any impact - it does show logged in employee only dataset (we use Power BI on Prem with PBI Report Server) they are allowed. so I figured whatever DAX calculation should adjust. I also suspect [Hierarchy] path in the employee table will play a role but I couldnā€™t figure what exactly!

@BrianJ, @Melissa thoughts? No intent to bother you but I figured I may learn a thing or two from your expertise as previously :slight_smile:

Thanks
Bare

1 Like

What Iā€™ve done in the past was create a team name for each manager, and assign the employees to a team. For second level, I had a table with each team name listed and the regional manager that oversaw the team. From there I was able to sort/filter by team or regional and all the calcs worked as expected.

1 Like

Thanks @mickeydjw

I got that far with the modeling as youā€™ve laid out. Itā€™s the team calc that stumps me:

image

So for each manager, I need to find a way to reference & obtain the total value for employees in the team reporting to the manager.

Did you experience something similar?

Thanks in advance
Bare

When I was leading those teams, there wasnā€™t a weight to be calculated. In your scenario, how are the weights per user and team determined? I canā€™t tell based on what youā€™ve shared so far.

My apologies as I attached the sample pbi file in the post.

Emp Dashboard.pbix (143.3 KB)

The tables and model are in the attached pbi file. So each weight & score per user is in the ā€˜employee scoreā€™ table. the team head weight are stored separately in the ā€˜DeptHeadWeightsā€™ (table not linked in the schema, not sure if this is right).

The business logic with the weights is to calculate attributions of each user on a recommendation (weights here representing efforts put in) for their individual performance.

E.g if I have 2 calls with scores of 120 & 90 with weights 30% & 20% respectively, then my individual performance would be (120 * 30% + 90 * 20%)/50% = 108. If i have no team to lead then this would be my total score

Now if I report to a manager, there will be a weight assigned to that manager as defined in the deptheadweight table, say 17%. it therefore means for that manager a team weight of 17% * 108 (my total score)

The challenge i have is obtaining the total score and using as input to calculate the total score of managers up the level.

Why are you adding the weights and then dividing total scores by that number?

Youā€™re double-weighing every line item when youā€™re calculating the score arenā€™t you?

My roster looked something along the lines of:

Name | ID | Team Name | Lead |

created a relationship from the roster to the fact table. then used team name or lead as a slicer.

Manager total = team total * manager weight.

Team total = Sum (total weighted score)

Dividing the total scores by the total weight is a weighted average concept - taking into consideration the effect of each part in contribution to the whole. Itā€™s a financial term in portfolio management.

1 Like

Thank you for the quick and dirty definition. I now have a bit of context for what youā€™re trying to showcase as the end goal. Iā€™ll play with it a bit more today.

Thanks @mickeydjw - much appreciate

Hey @Bare ,

The part I keep getting hung up on is that the weights donā€™t ever seem to add up to 100% unless the employee only has 1 metric, but thatā€™s not always the case. Emp M is solo with 80%

Also, none of the reading Iā€™ve done this morning for calculating weighted averages ever mentions summing the weights themselves. Unless Iā€™m misunderstanding, the weighted score from your example should be 120 * .3 + 90 * .2 = 54 points the average weight for this person would be 25%. Taking your total by your avg weight gives you 52.5 points. These numbers seem to jive in my head.

What piece of the puzzle am I missing here?

Hey @mickeydjw

You are not missing any puzzle, really.

The weights do not add up to 100% per employee by design - this weight is for only part of what they are responsible for. the remainder of the weights are assigned to other tasks not relevant for this use case. Hence I ignored that.

You are right about your reading - in strictly financial terms, the example of 120 * .3 + 90 * .2 would be the classical way to go from portfolio perspective. However, the business logic here is the performance of the employees & hence further consideration is given to the sum total of weights for the stocks they are responsible for. So dividing 54 points by .5 would give a score for that employee of 108.

In a nutshell, your readings are correct. Thereā€™s just that ā€˜proprietaryā€™ angle to it. So, no you are not missing any puzzle :slight_smile:

Ok, so now that Iā€™m clear on that one letā€™s confirm a couple more assumptions:

Employee A has their weighted score but no teamā€“easy calculation

Employee B has their weighted individual score plus their team (Employee A) multiplied by their management modifier-- (Weighted individual Total A + Weighted individual Total B) * management modifier

Employee C is Bā€™s manager. They get their weighted individual total plus their team total which includes the weighted total from team B.

Are we missing any other factors?

Hi @mickeydjw

Correct on Employee A = weighted total(A)

Employee B total = weighted individual B +  weighted total(A) * management modifier(B) = weighted total(B)

Employee C total = weighted individual C + weighted total(B) * management modifier ( C ) = weighted total( C )

So in short, no not missing any factors beyond the fact we may have more than one reporting line into a manager

So no manager bonus on personal production. Got it.

Yep.

Inn the meantime, hereā€™s how far I have come (or rather where I got stuck).

So I thought to take it step by step by going as follows:

  • create calculated columns in the ā€˜Employeeā€™ table with:

Team L0 where column ā€˜head roleā€™ = ā€œnā€
Team L1 with code: PATHITEMREVERSE(Employee[Path], 2, Text)
I repeated above code all the way to the last level Team L3

Why did I do this? To get a structured lineage of who reports to who.

  • Next I try to create a virtual table to visualize that I am actually getting teams for a particular manager. I used:

      virtual table test = 
          SUMMARIZECOLUMNS(
              'Employee'[Employee ID],
              'Employee Score'[EmpScore],
              'Employee Score'[Weights],
                  CALCULATETABLE(
                      FILTER(
                          Employee,
                          PATHITEMREVERSE(Employee[Path], 2, TEXT)),
                          Employee[Team L1] IN {"Emp B"})
                          ),
                          "current score", [Latest Score],
                          "latest date", MAX('Employee Score'[Month])
                  )
    

But I get an error ā€œCannot convert ā€˜Emp Bā€™ of type Text to type True/Falseā€

And thatā€™s where I got stuck with the error as I guess this would work if ā€œEmp Bā€ in integer?

The goal is to use the list of employees for each manager as input for row by row calculation for total score. What do you think?

I have attached the file as used:

Emp Dashboard.pbix (133.2 KB)

@Bare,

Took a look at your virtual table test, and saw a number of structural problems with the DAX. Rewrote it based on what I thought you were trying to test, however, I couldnā€™t figure out your objective with the CONTAINSROW statement, so I commented it out for now. See if this helps get you unstuck:

virtual table test = 

CALCULATETABLE(
    ADDCOLUMNS(   
        SUMMARIZE(
            'Employee Score',
            'Employee'[Employee ID],
            'Employee Score'[EmpScore],
            'Employee Score'[Weights]
            ),
        "current score", [Latest Score],
        "latest date", MAX('Employee Score'[Month])
    ),
    FILTER(
        Employee,
        PATHITEMREVERSE(Employee[Path], 2, TEXT) = "Emp B" 
        //CONTAINSROW()
    )
)

I hope this is helpful.

  • Brian

Hi @BrianJ

This is very helpful, thanks!

To keep only latest scores, I remove the ā€˜EmpScoreā€™ and indeed it worked. Donā€™t know why it wasnā€™t returning only the latest (max) empscore but the ā€˜current scoreā€™ has that factored in anyway.

Re CONTAINSROW(), I was actually trying to figure out why ā€˜INā€™ was not working (I understand these both perform same function), not that it mattered. I have used either in the past but on integers & it worked. Could it be not the same for text criteria?

But thanks help on the virtual table!

@Bare,

No, the IN operator definitely is applicable to text as well. Hereā€™s a great exploration of how it works and can be used:

Hope this is helpful. Give a shout if youā€™re still having problems with it.

  • Brian

Thanks @BrianJ

Ok. I guess I was applying it wrongly.

One other thing. Is it fair to say one canā€™t process created columns from a virtual table? I mean the virtual table per above, if I were to use this in a DAX as VAR I canā€™t perform addition (sumx on the VAR), for example, on ā€œcurrent scoreā€ as it returns me blank. However, it works fine if I have the virtual table as tangle table in the model. Or am I doing something wrong?

@bare,

OK, for a short post, you raised a ton of great questions. Let me try to answer them systematically:

  1. no, you can absolutely call/process created columns from a virtual table. However, doing so is a bit funky, since the naming conventions are not consistent with any other part of DAX. Instead of the typical ā€˜tableā€™[column] call structure, created columns in a virtual table get called like measures. I.e., [column]. This can get very confusing, which is why Marco Russo recommends (see article posted @ the end) as a best practice naming your virtual columns in the ā€˜tableā€™[column] format, so that when you call them within DAX they make like they are adhering to the standard call structure. Alternatively, you can do what most of us do which is to retrain ourselves when working with virtual tables to always ask whether something alone in brackets without an explicit table reference is a measure or a virtual column.

Hereā€™s your revised virtual table code, rewritten as a variable within a measure that ultimately is called when calculating the AVERAGEX of the virtual score column:

virtual table AVERAGEX = 

VAR vTable = 
CALCULATETABLE(
    ADDCOLUMNS(   
        SUMMARIZE(
            'Employee Score',
            'Employee'[Employee ID],
            'Employee Score'[EmpScore],
            'Employee Score'[Weights]
            ),
        "current score", [Latest Score],
        "latest date", MAX('Employee Score'[Month])
    ),
    FILTER(
        ALL(Employee),
        PATHITEMREVERSE(Employee[Path], 2, TEXT) = "Emp B"
        //CONTAINSROW()
    )
)

VAR vAvgScore =
AVERAGEX(
    vTable,
    [current score]
)

RETURN
vAvgScore
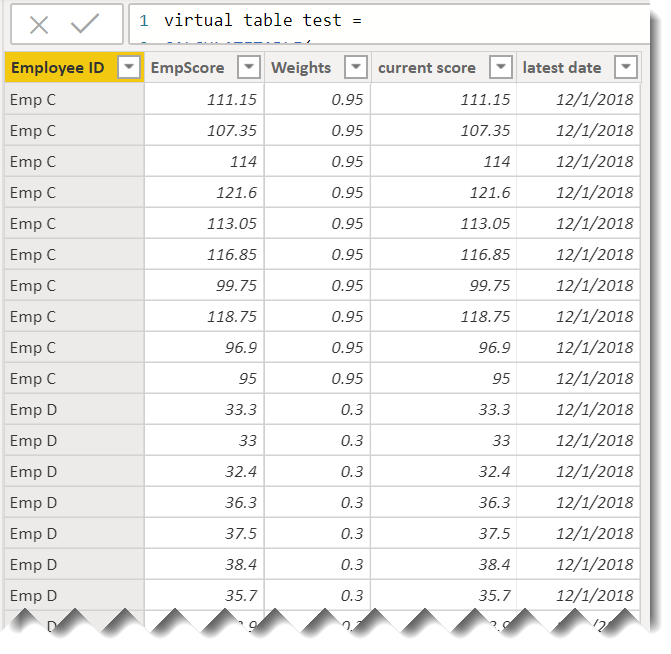
  1. materializing virtual tables through the is a terrific way to debug virtual table code, but as you can see is not always reliable. When you materialized your table, it returned a number of rows, but when you did it as a variable it returned no rows and always led to BLANK() as your answer. The reason is that the measure occurs within context of the visual/page/report, while the table is calculated outside of context. In this case, we had a slicer on the page that was filtering the table down to only Emp ID = Employee B. But in the virtual table code, we had a filter condition that said

PATHITEMREVERSE(Employee[Path], 2, TEXT) = ā€œEmp Bā€

Taken together with the slicer, this means that we were looking for records in which Employee B was both the employer and the supervisor, which in this case was the null set. The materialized physical table however was created outside the context of the slicer, so it returned the proper records. The way to solve this is just to wrap the Employee table call in an ALL() statement to override the slicer. Once you do that, it returns the proper records.

  1. generally speaking, you definitely want to build your reports using virtual tables in your measures rather than calls to materialized physical tables calculated by DAX. Two major reasons: 1) doing the former keeps your data model clean and simple; 2) more importantly, virtual tables within a measure are completely dynamic, whereas materialized physical tables only get calculated upon load or manual refresh.

I hope this clarifies things, but these are pretty complex issues that for me at least only really "clicked"with a lot of practice. However, I completely agree with @sam.mckay that mastering virtual tables is what makes your DAX take a quantum leap forward.

Please let me know if any of this isnā€™t clear and/or if you have more questions. Solution file posted below,.

1 Like