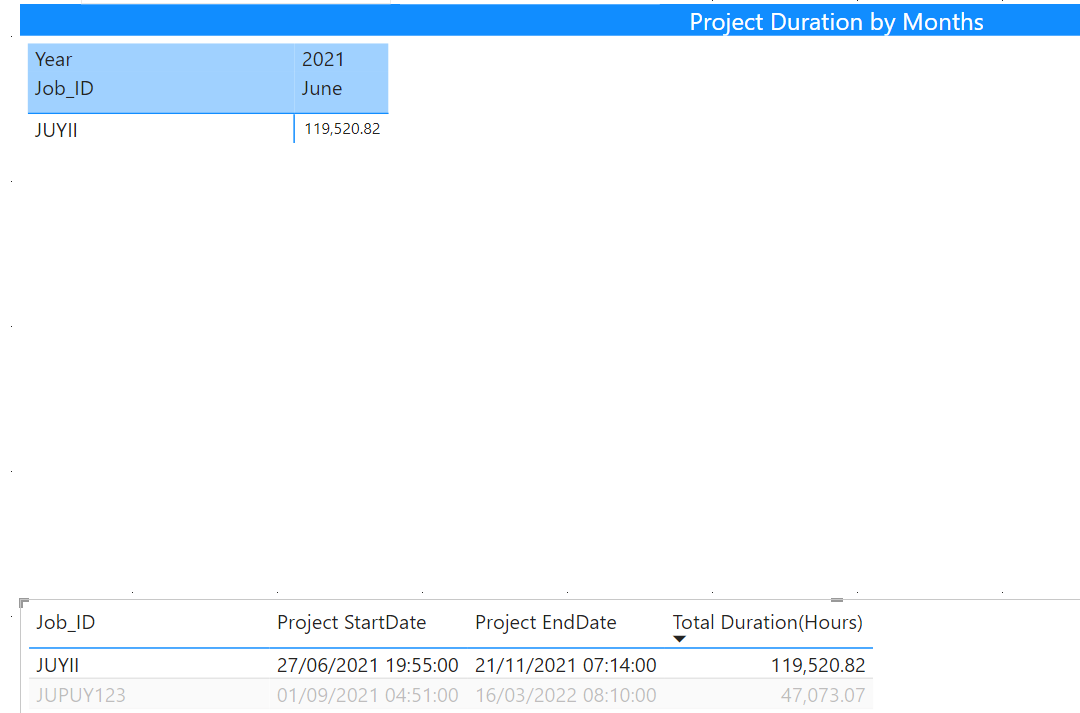
My requirement is to calculate cumulative job duration by month by year. This sound simple. The issue is that a project may begin in April for example and never ends until November and possibly the into another year. And because there is no timestamp sometime till after some months, it becomes difficult to calculate values for months in between start time and end time for any particular month. Strangely, this is my requirement.
For example, in the second image above, the Job Id JUYII started the project on 27/06/2021 and ended on 21/11/2021, the user still wants to see the duration spread across June to November (duration total for June, July, August etc) rather than aggregating the duration total to just June. The total should not be for June only. It should be spread across the multiple months for the project duration.
Any logic around this?
I anticipate your help
My file is attached. ProjectData.pbix (1.0 MB)
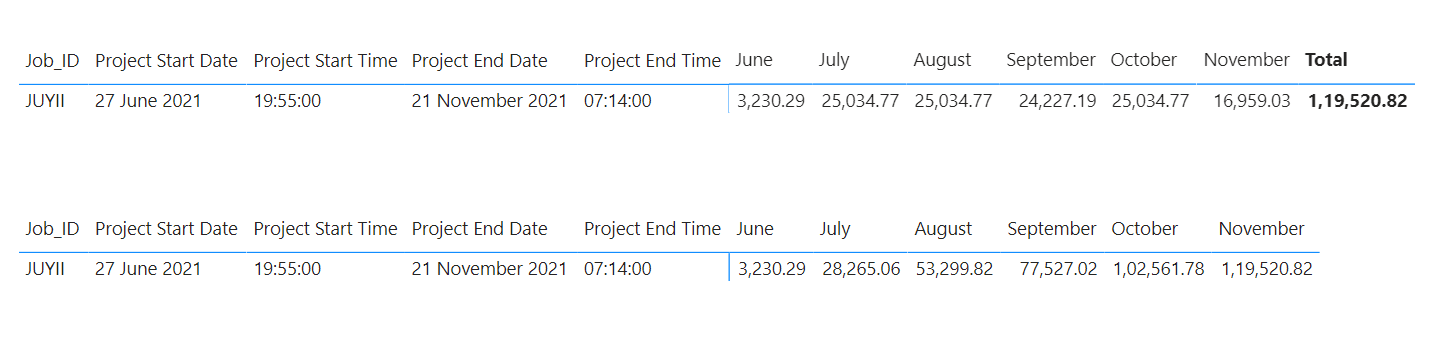
Based on the criteria that you’ve suggested that you want to split the number of hours between the months and then show the cumulative totals as well. Below are the measures alongwith the screenshot of the final results provided for the reference -
Split of Hours =


----- Calculation of Total Duration Hours -----

VAR _Total_Duration_Hours =
SUM( 'Project Data'[Total Duration(Hours)] )


----- Calculation of Consolidated Total Hire Days -----


VAR _Total_Hire_Days =
CALCULATE(
    VAR _Table_1 =
    FILTER( DATES ,
        DATES[Date] >= SELECTEDVALUE( 'Project Data'[Project Start Date] ) &&
        DATES[Date] <= SELECTEDVALUE( 'Project Data'[Project End Date] ) )

    VAR _Hire_Days =
    COUNTROWS( _Table_1 )

    RETURN
    _Hire_Days ,
        ALL( Dates ) )


----- Calculation of Individual Hire Days -----


VAR _Table_2 =
FILTER( DATES ,
    DATES[Date] >= SELECTEDVALUE( 'Project Data'[Project Start Date] ) &&
    DATES[Date] <= SELECTEDVALUE( 'Project Data'[Project End Date] ) )

VAR _Individual_Hire_Days =
COUNTROWS( _Table_2 )


RETURN
DIVIDE( _Total_Duration_Hours * _Individual_Hire_Days , _Total_Hire_Days , 0 )
Hi @Harsh , thank you so very much for the great job. I have had a hard thought on why you did not jon the Date table to the Fact table. Please, any reason why did so? I just want todigest the logic behind this reason. I am very grateful
Thank you
Sure, here’s the reason why I didn’t created a relationship with the Date table -
So, since we’ve multiple date fields in the fact table and now, if we create an active relationship then it’ll have a direct effect on the evaluation of the results since that active relationship will start filtering the results.
And now, since the criteria is to apportion the results for each month. Firstly, we need to identify for how many days a particular job was on a hire and then by using the Date table virtually we need to break it down at a monthly level. And once we’re able to apportion it then we can furthermore apportion those “Total Duration Hours” by breaking it down at a monthly level. And that’s why I used the comments in the measure to highlight what each variable is doing.
I’m providing few of the links below for learning purposes pertaining to the handling of multiple date fields in Power BI.
Hoping you find this helpful.
Note: The examples showcased in the video is different but once we understand the concept of handling mutiple date fields we can mould it accordingly as per our business specific requirements.


")