Hi everyone, this is an entry submitted by Maha Othman sent to us via email.
You may view the full report here:
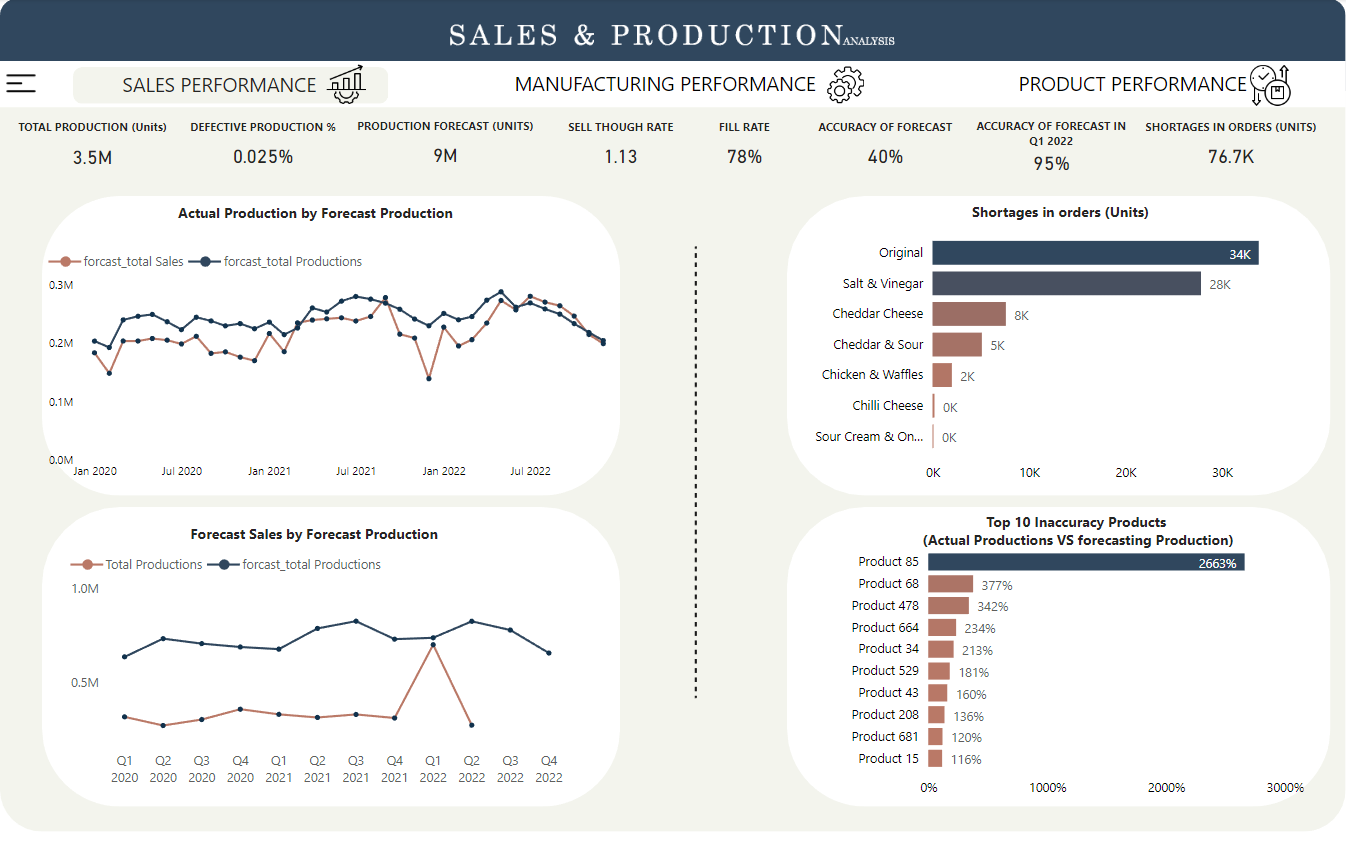
Maha Othman
Please feel free to give Maha your feedback on her report.
Hi everyone, this is an entry submitted by Maha Othman sent to us via email.
You may view the full report here:
Maha Othman
Please feel free to give Maha your feedback on her report.
Hi everyone, this is an entry submitted by Vincente Antonio Juan sent to us via email.
You may view the full report here:
Vincente Antonio
Please feel free to give Vincente your feedback on his report.
Hello, I’m new to Enterprise DNA, and just opened up this challenge this week and am running into some of the same confusion about the data as others in the forum, but i did attempt to make my own model. Could I get a copy of the already modeled data you offered so i can compare my work? I’m new to the forum so i can’t directly message the challenge team yet, so I hope there’s a way for me to access the modeled report. Thank you!
Thank you so much! I did like working with the data, it seemed accessible at first, but there were just a few spots of confusion. I appreciate you offering up the modeled data!
Good luck, check the forum for already provided answer to some questions and or please feel free to post your question here in the forum if you have any further doubts.
Regards,
Federico
Hello everyone,
I am still trying to understand the data that we are going to have available in the Finished Goods Inventory and Sales Orders tables.
We know that both reports are going to be run daily.
In the case of the Finished Goods Inventory, will we only have the last inventory made available or will the new inventory records be added to the existing records in the excel, so we can consult more than one inventory in the report?
In the case of Sales Orders, I think we are only going to have the information from the last report made.
Regards,
Hi @BernatDuran ,
Until now I had not come to this question.
I think that to determine the products of the finished goods inventory with no sales or with low sales we have to go based on the units consumed column. We can take into account all the items in the inventory or only those in which the units in inventory (Opening + Produced) are > 0.
To determine what counts as low sales, we could create a parameter to display items whose units consumed are less than the user-specified value.
Let’s see what the rest of the forum members think.
Regards,
In Finished Goods inventory report, only the current balance will show (last inventory available). In Sales orders, new orders will be added daily (replaced, increased or decreased as per the inventory or machine availability).
Thank you for your kind response @jafernandezpuga !
I’ll take it as you are arguing, it has sense.
Regards!
Hi @MudassirAli,
If we only have current day sales information in the Finished Goods Inventory and in Sales Orders is the sales information for the next 14 days, should we rely on these 15 days to get the items with no sales or with low sales in instead of only in the information of 1 day of the Inventory?
For the current data, in Sales Orders we have the information of the stock from 05/05/2022 and of the Sales Orders from 05/07/2022 to 05/20/2022.
If the information is updated today, would we have the stock information from 06/22/2022 and the Sales Orders from 06/23/2022 to 07/06/2022?
Thank you very much,
Hi everyone, this is an entry submitted by Franziola Chiu sent to us via email.
Do share your feedback!
You may view the full report here:
Franziola Chiu
Please feel free to give Franziola a your feedback on her report.
Hi everyone, this is an entry submitted by Sibi Maran sent to us via email.
Here’s how sibi described it:
Hello Everyone,
I have accepted DNA Challenge 20- Production and Sales Analysis.
Thanks to Federico Pastor and Enterprise DNA Ltd for posting this challenge.
Do share your feedback!
You may view the full report here:
Sibi Maran
Please feel free to give Hadiqa your feedback on his report.
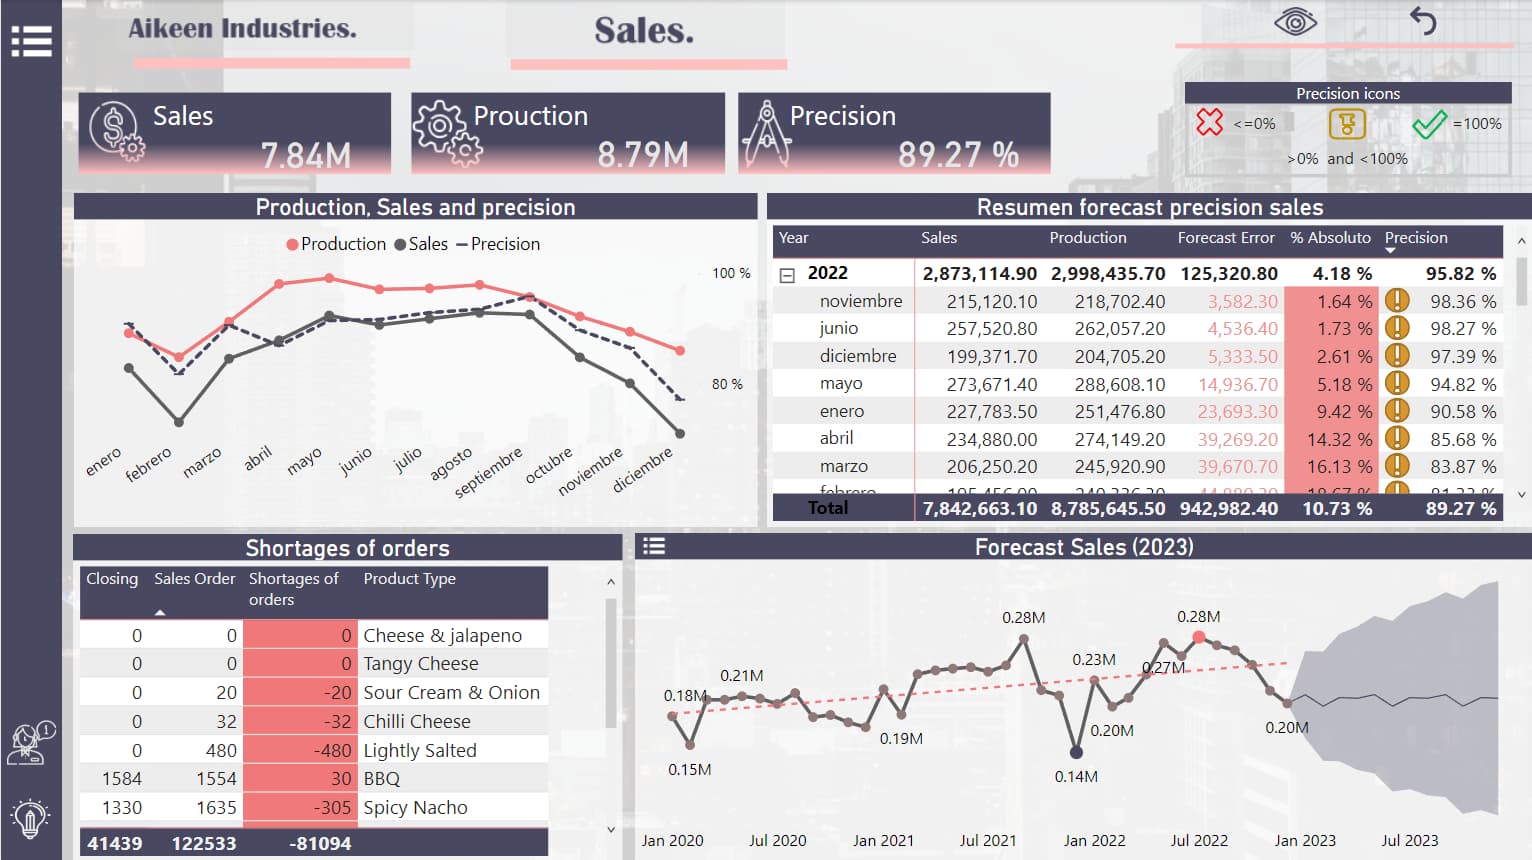
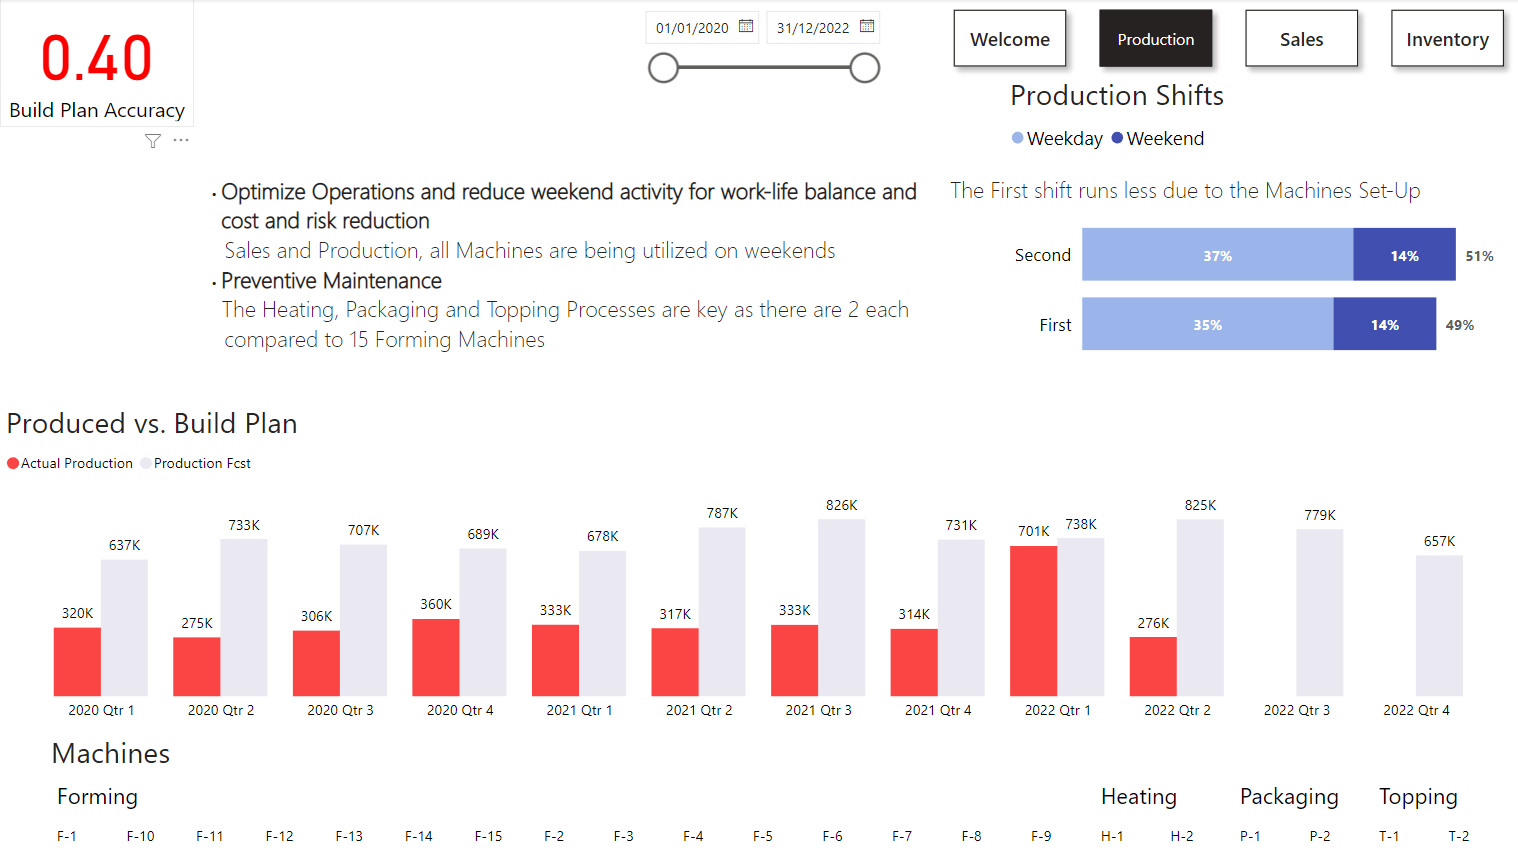
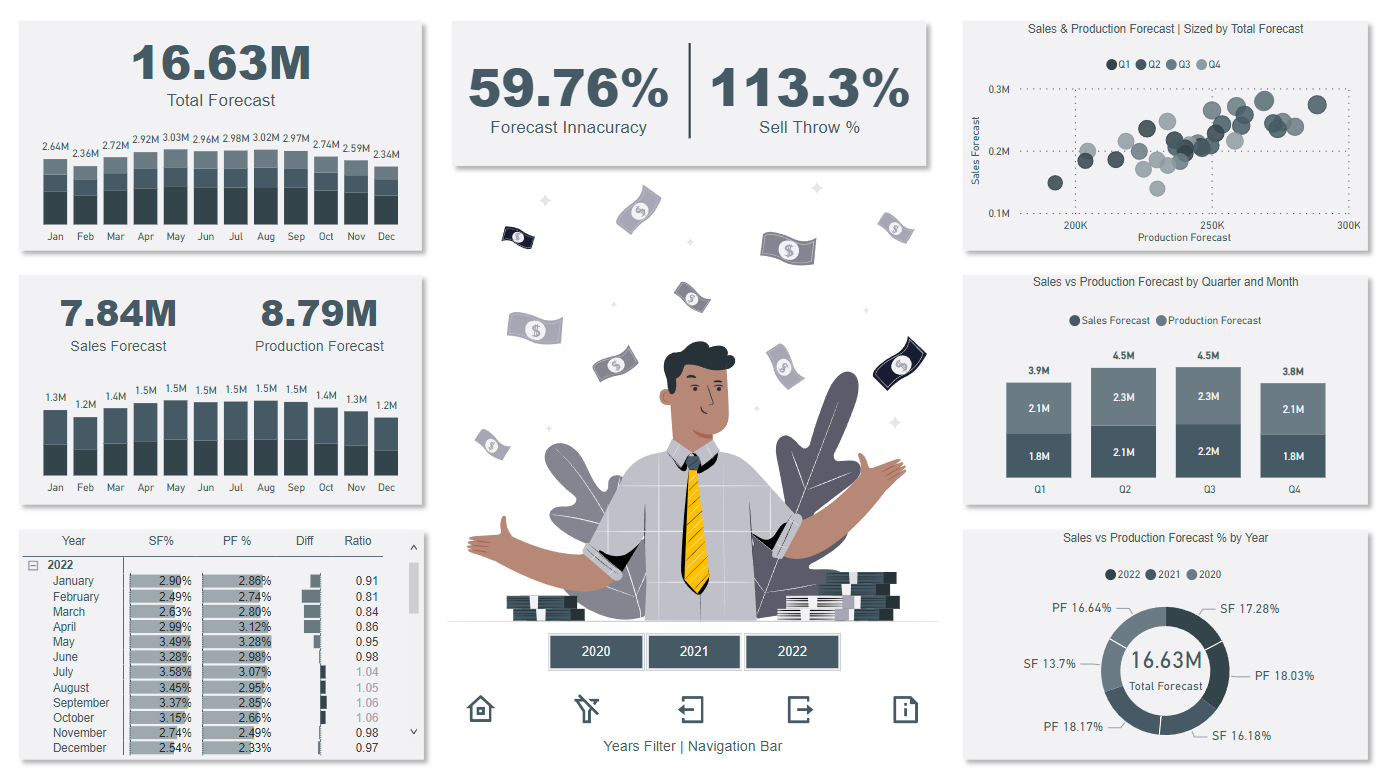
Hi Members,
Please see my entry for Challenge 20 " Sales and Production Analysis". A difficult dataset and calculations to produce. 10 questions to asnwer, no sure I got them all but, as usual, I tried my best.
I decided to go with a fun illustrations theme this time and blue/green/greyish colour palette.
Pascal Kiefer kudos to your end-user help idea with Gif. I put it in the report, I need to perfect it but excellent idea the use of Gif for the provision of guidance to end-users.
Please see screenshot and link to the web of my report.
I hope you like it.
Federico Pastor
Dear fellow particiants,
I see several great submissions coming up, which is great and encouraging me to work on my own submission as well.
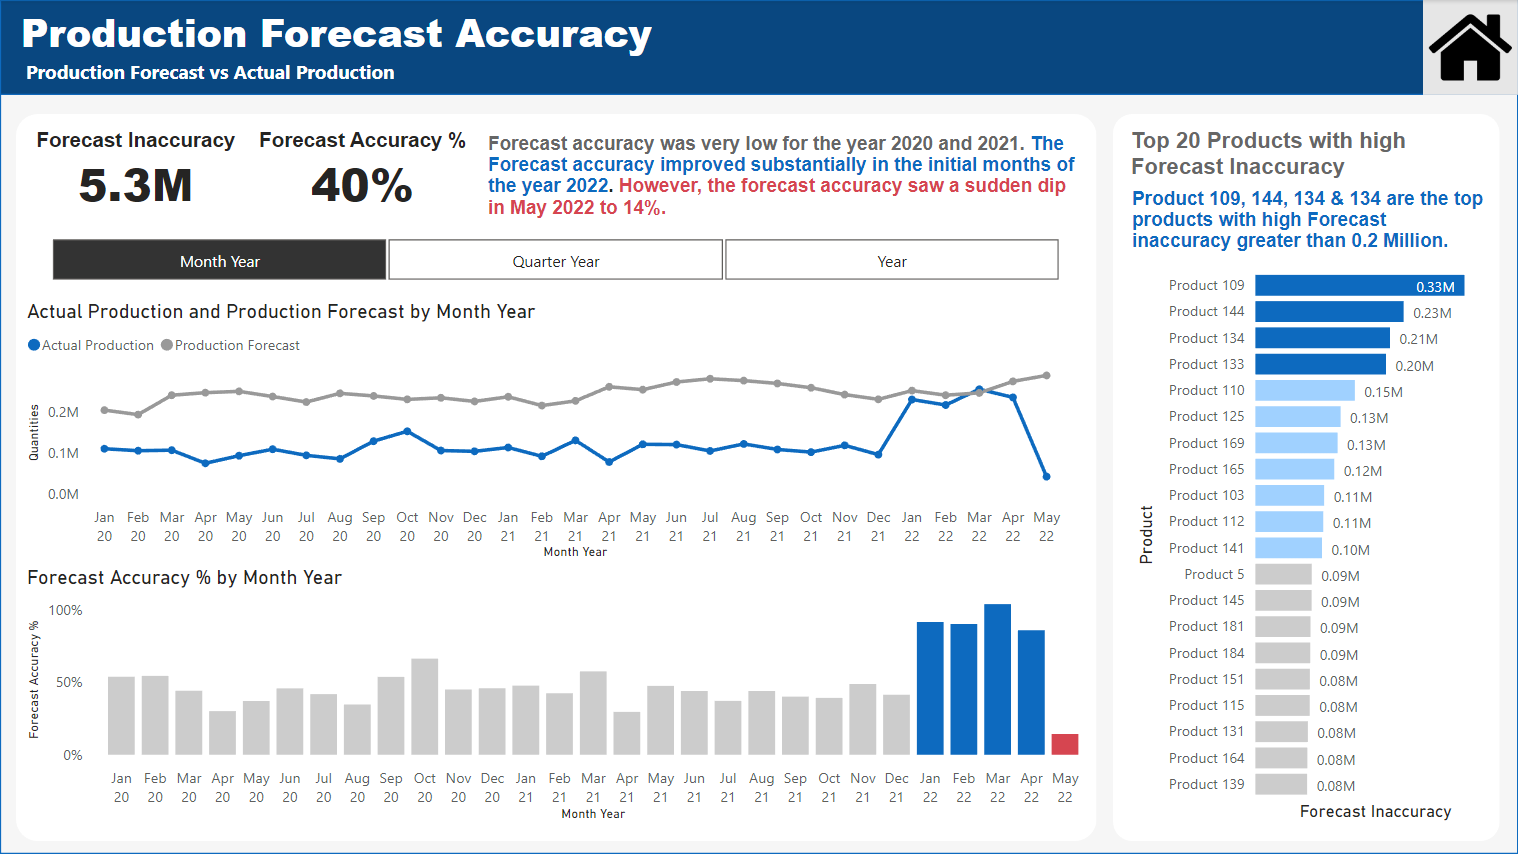
One thing I noticed is that the ‘Forecast Accuracy’ is often presented as 40%. I humbly doubt whether that is correct. Yes, it is EXACTLY done what was in the brief, but I think we need to consider the fact that there has been no production data as of the 6th of May, so calculating it for all 3 full years in my opinion is not fair.
I myself have decided to go with the months for which I have a full month worth of production: Jan 2020 - April 2022 for the calculation of the Forecast Accuracy.
It is like that old philosofical phrase: Forecast Accuracy can only be understood backwards (and we can calculate a better one forwards)  .
.
What do you think?
Do I overlook something super obvious?
KR
Jonathan
Thanks for your post, take the way your skills tell you to go. This is what I would say to you in this occassion. We’re here learning together and whether we’re 100% right or wrong takes a secondary position in my view.
Nonetheless I am sure other participants will be able to contribute to this discussion.
Regards,
Federico
Hi @Johnny ,
The approach that I have followed to be able to compare the Forecast Production against the Actual Production, in which the first one we have at the monthly level and the other at the day level, has been to create a measure to distribute the Monthly Production Forecast between the days of each month.
For this I have followed the following video by @sam.mckay in which he explains how to do it in detail.

Regards,
Hi @jafernandezpuga ,
I followed exactly the same approach and used the same video. The explanation from Sam is more than excellent. This tecnique is extremely useful!
Regarding your comment @Johnny , in some way it can be useful to compare the forecast to entire year even if you lack some months of actual production in your data model.
You can always select the dates filtering by the slicer. So, if you want to compare the first quarter, you will select 01/01 - 03/31. But you still can compare from 01/01 to 12/31 and you will know that if the forecast is below 25% (imagine that you have data till 03/31) you are behind the forecast. Of course, that’s the way I see it!
Regards!
Good video indeed.
I see your point BernatDuran. In my humble opinion I think it needs some extra work in the mind of the user to calculate whether the 40% up until May, but calculated across all months is good or bad.
Anyways, I don’t want to initiate a debate here. As always there are “multiple roads that lead to Rome” and in a real world scenario I think I would just ask the client, to check what makes most sense to him/her.