@Johnny I absolutely agree with you. Calculating the forecast accuracy when the actual production is not available for the whole month of May 2022 is inaccurate. One way to do this is to project the actual production of the whole month of May 2022 (there are various methods to do that) and then calculate the forecast accuracy or leave it altogether.
1 Like
Hi everyone!
Here it is my report.
I hope you will like it at least as much as I enjoyed building it!
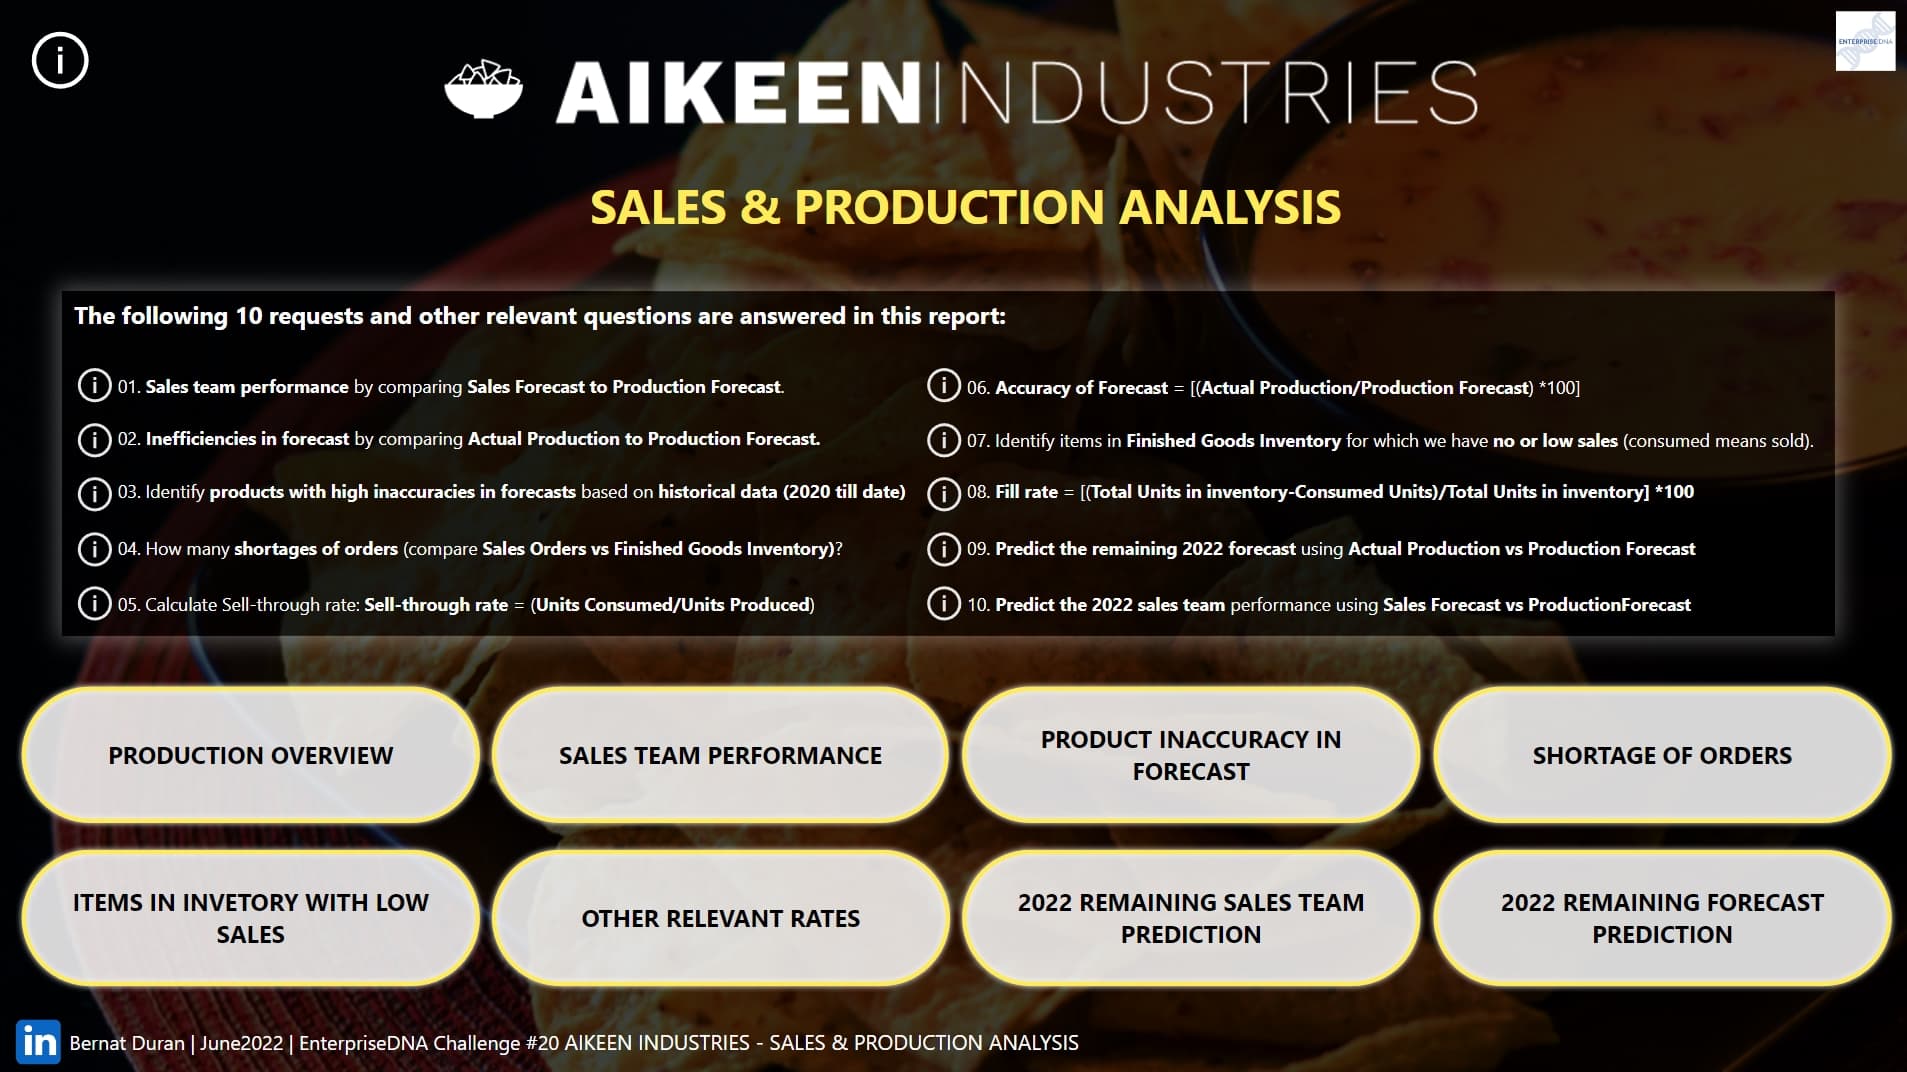
At the beggining some doubts came to my mind while I was thinking about the approach of the challenge. Finally I decided to structure the report trying to answer the main 10 request from Aikeen Industries CEO, that’s the reason why this report has a noticeable number of pages.
When interacting with the report, some of you may think: “Why there is no navigation pane in every page?” I decided not to include it because I want the user to focus on the request and then to select the proper page related to it. The way I created the report, there is no dependance between the pages.
Like some of you have commented above, building this report has been a true challenge, I find it more complicated than the previous one.
Some screenshots down below:
0. Home Page
Details
It took me a while to decide a proper theme for this challenge. I decided to bet for a yellowish/white colours and a dark theme. I also looked for a funny and appropiate icon and a proper wallpaper.
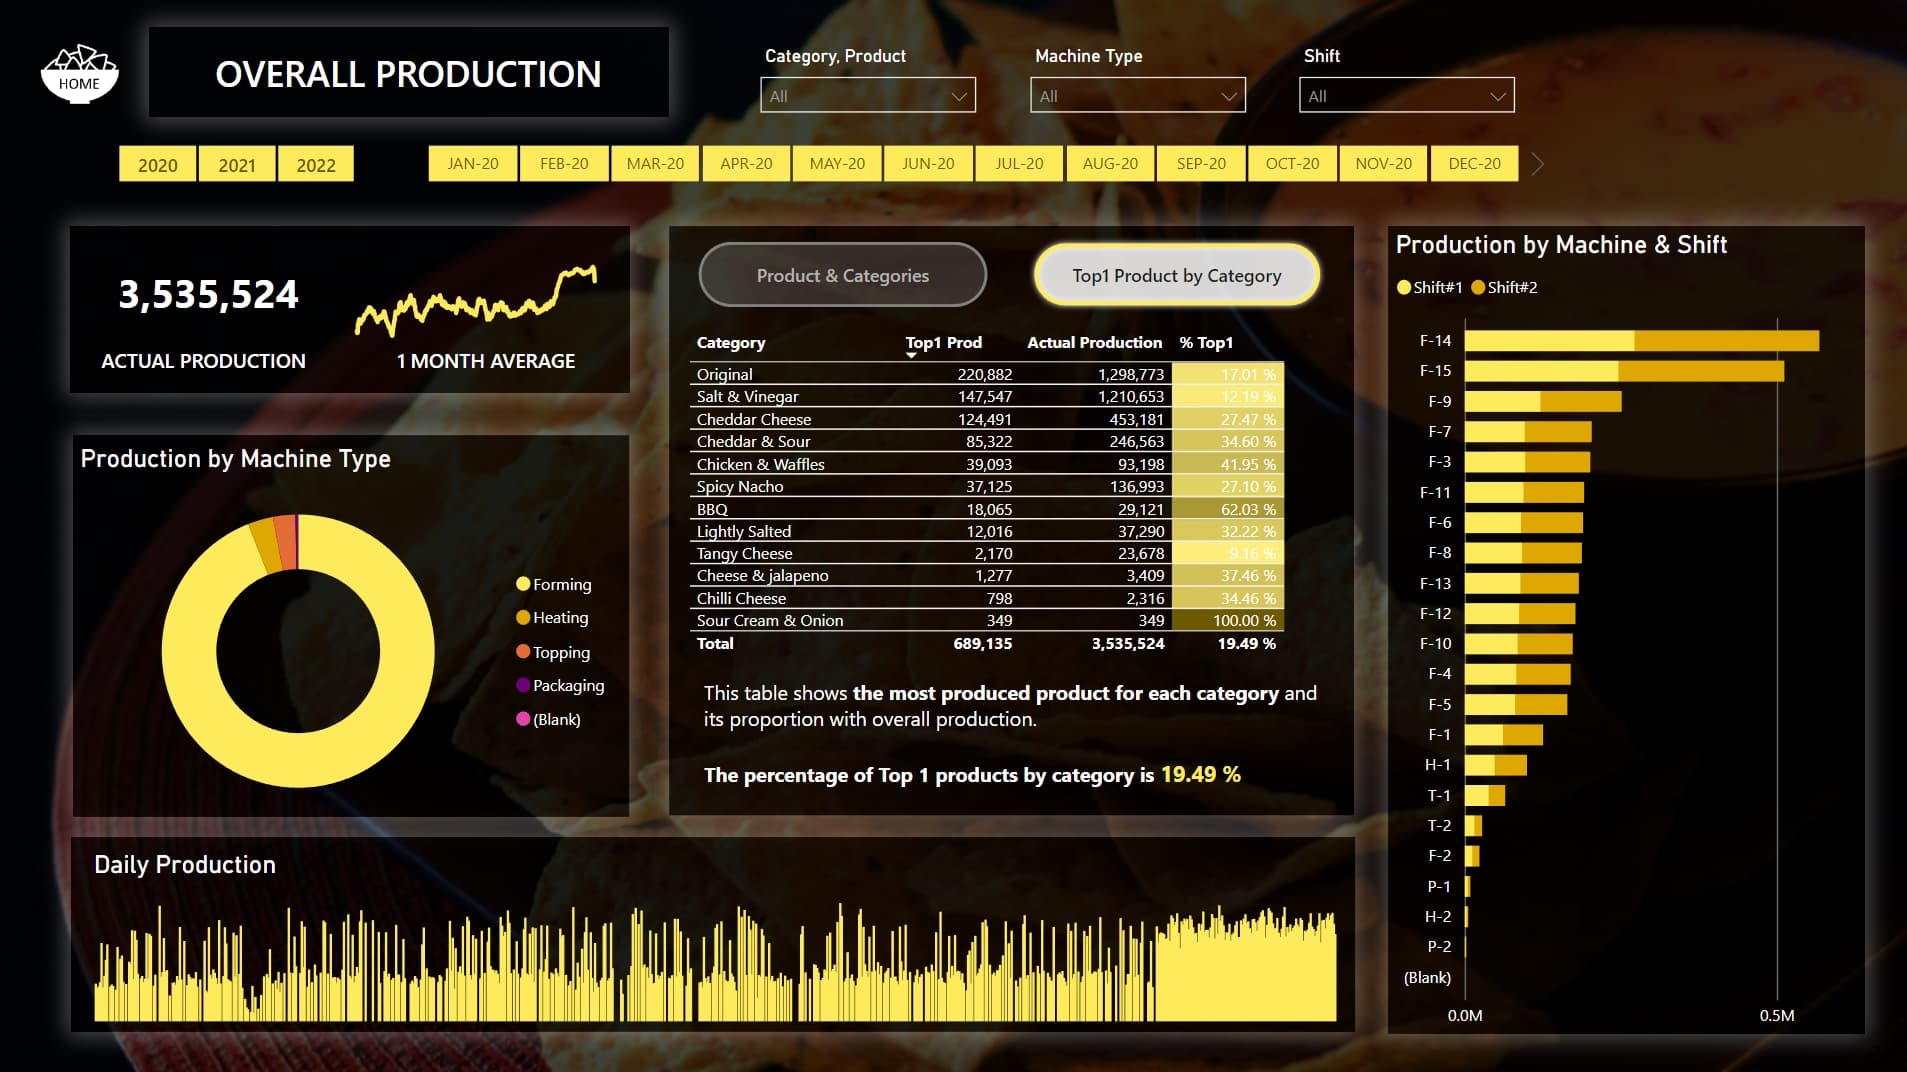
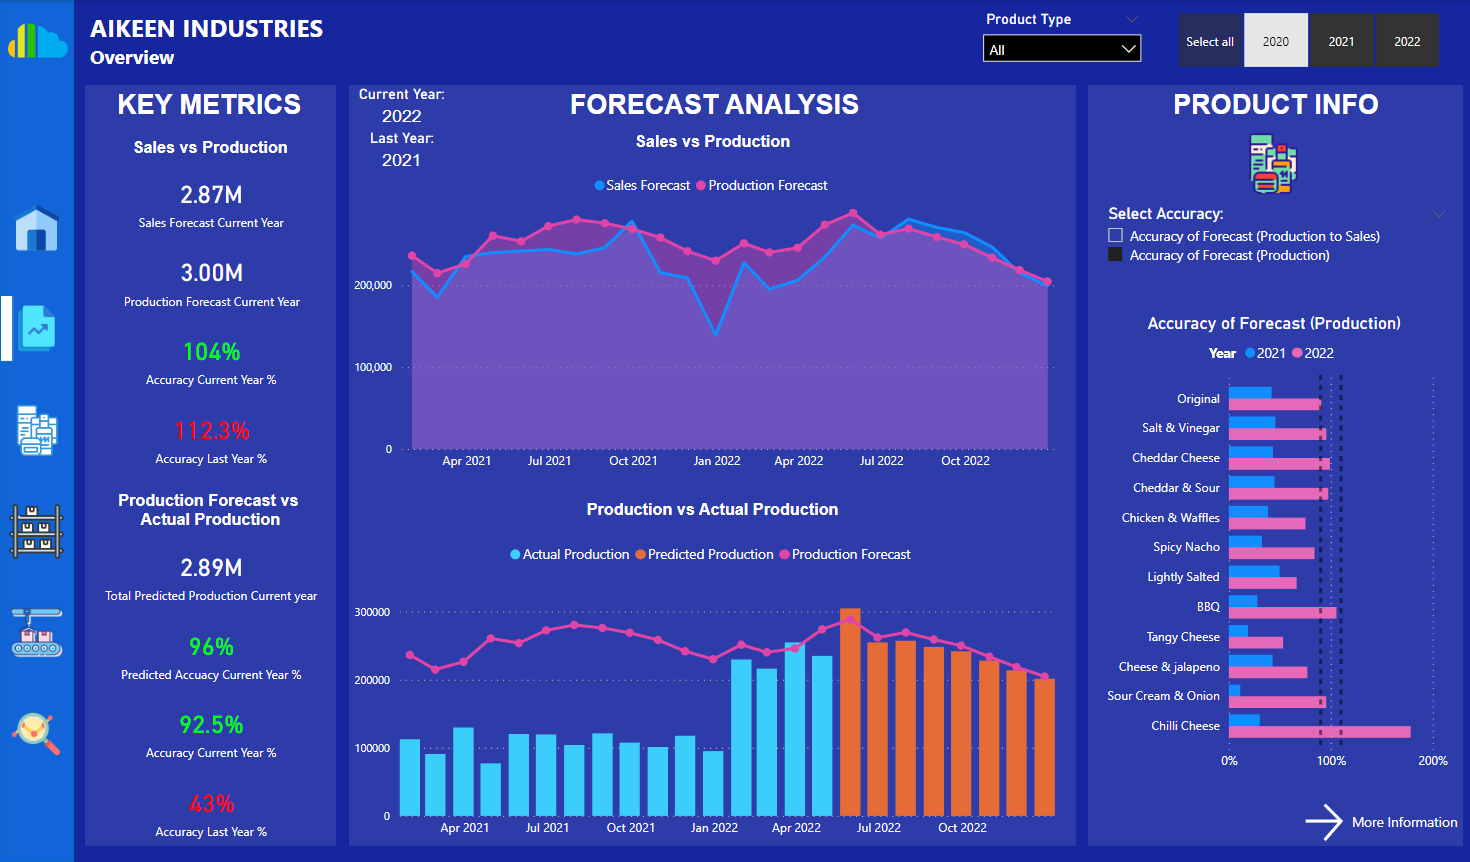
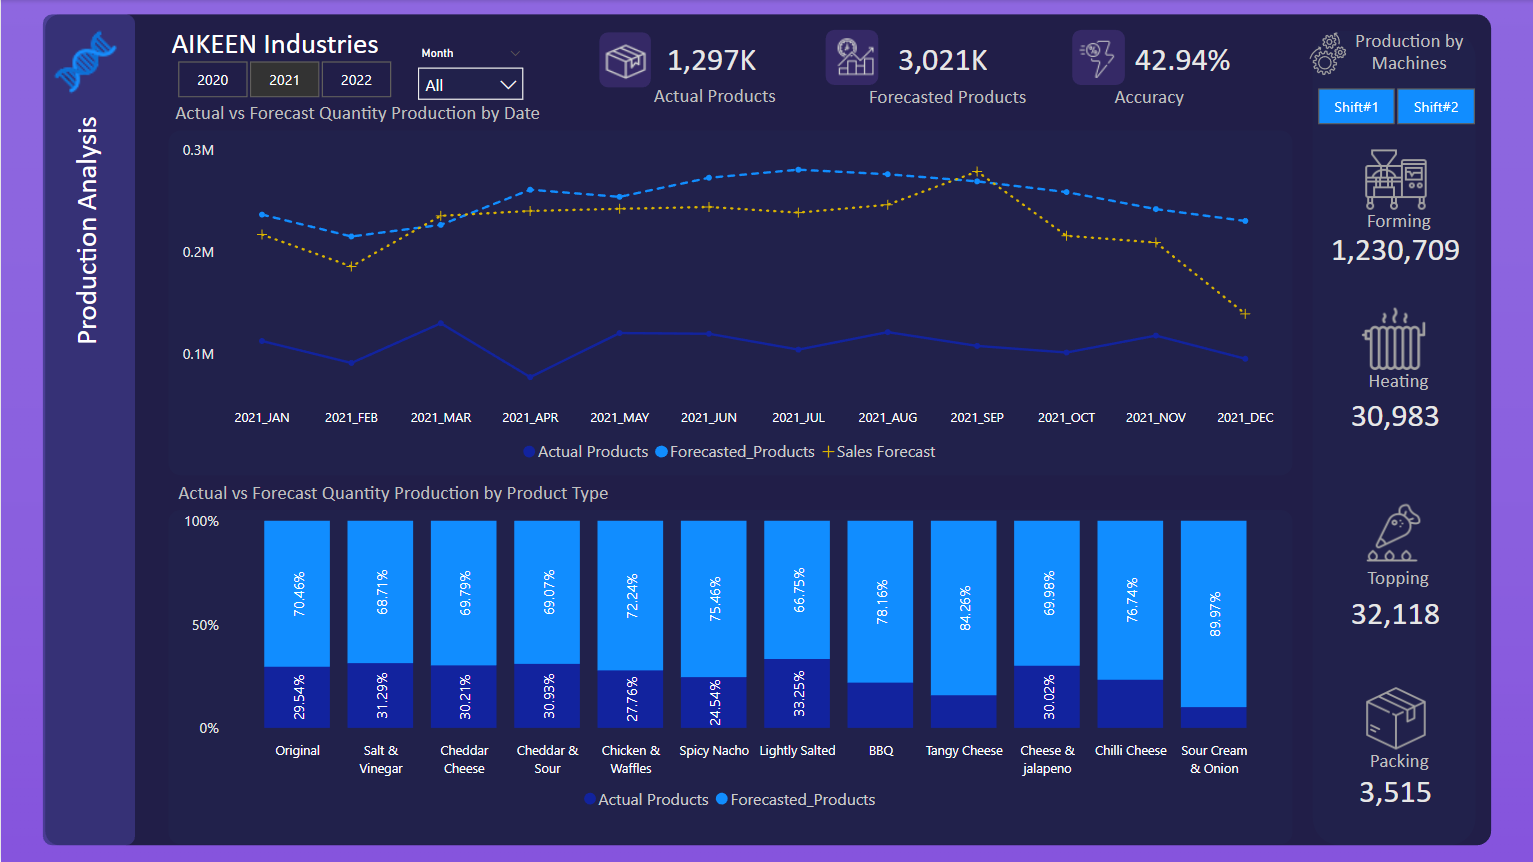
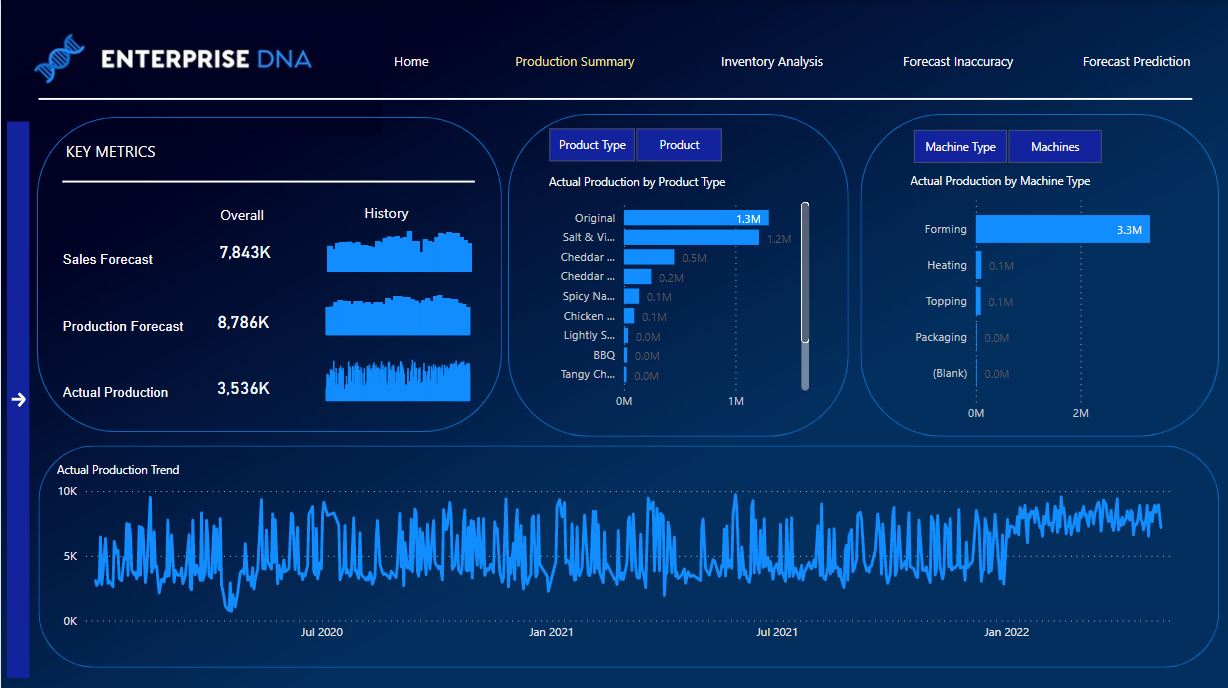
1. Overall Production
2. Sales Team Performance
Details
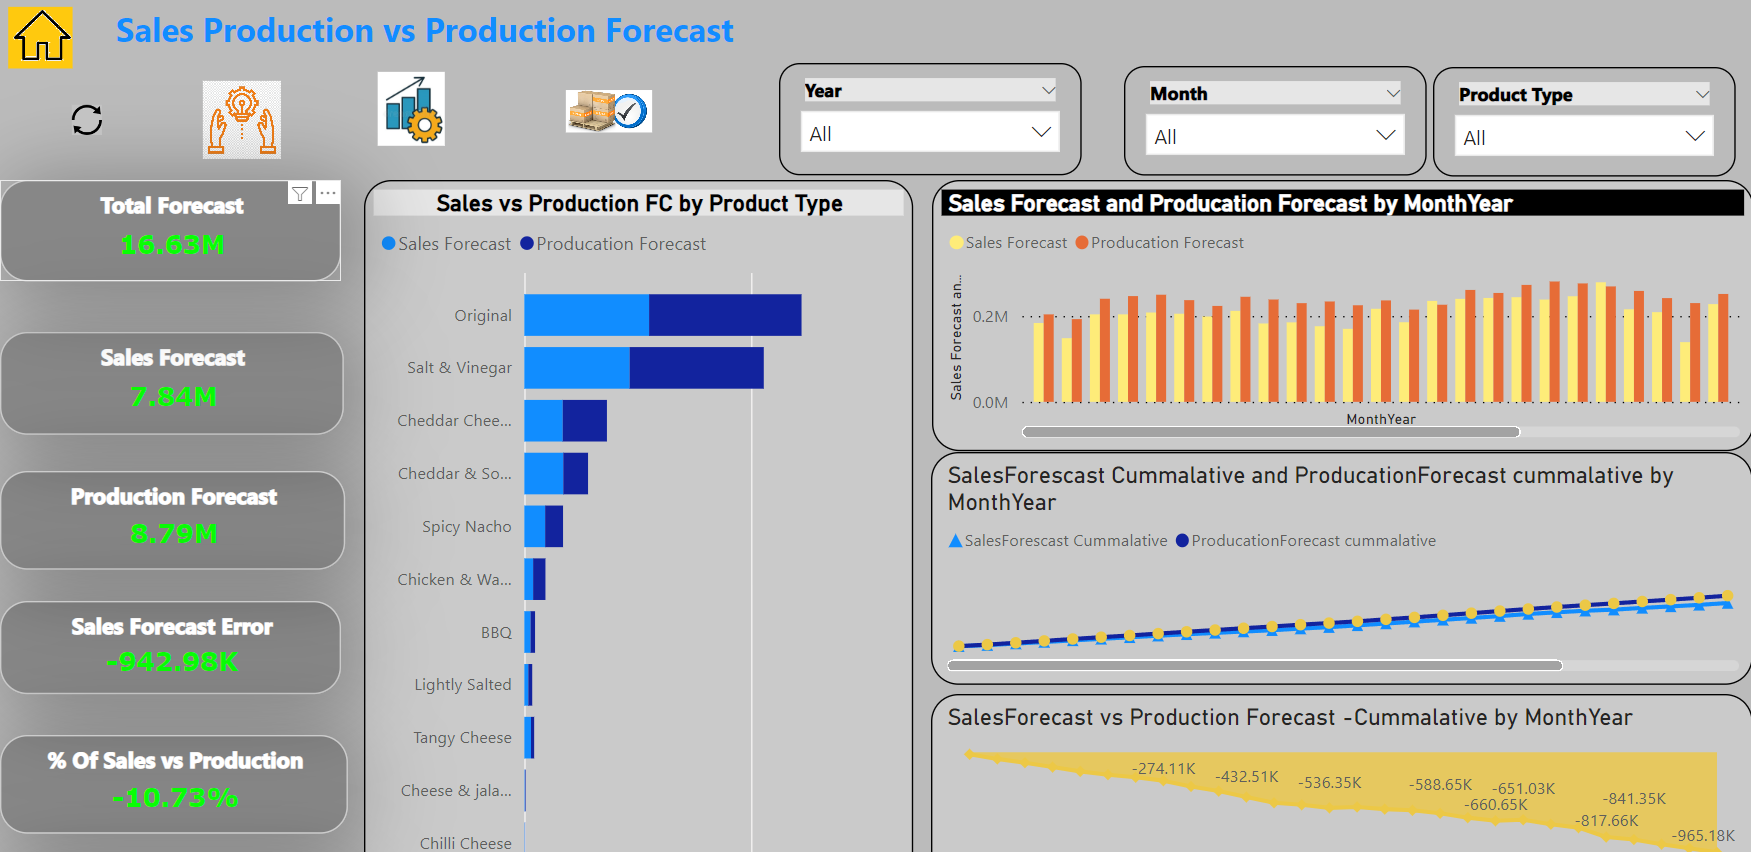
Some of the videos published by @sam.mckay some time ago inspired me to approach the comparison between two different metrics like Sales and its Forecast or Sales vs Production this way.
To my mind, tracking the cumulative and the difference between the cumulative of the metrics is an excellent way to compare the evolution in a period of time between two metrics.

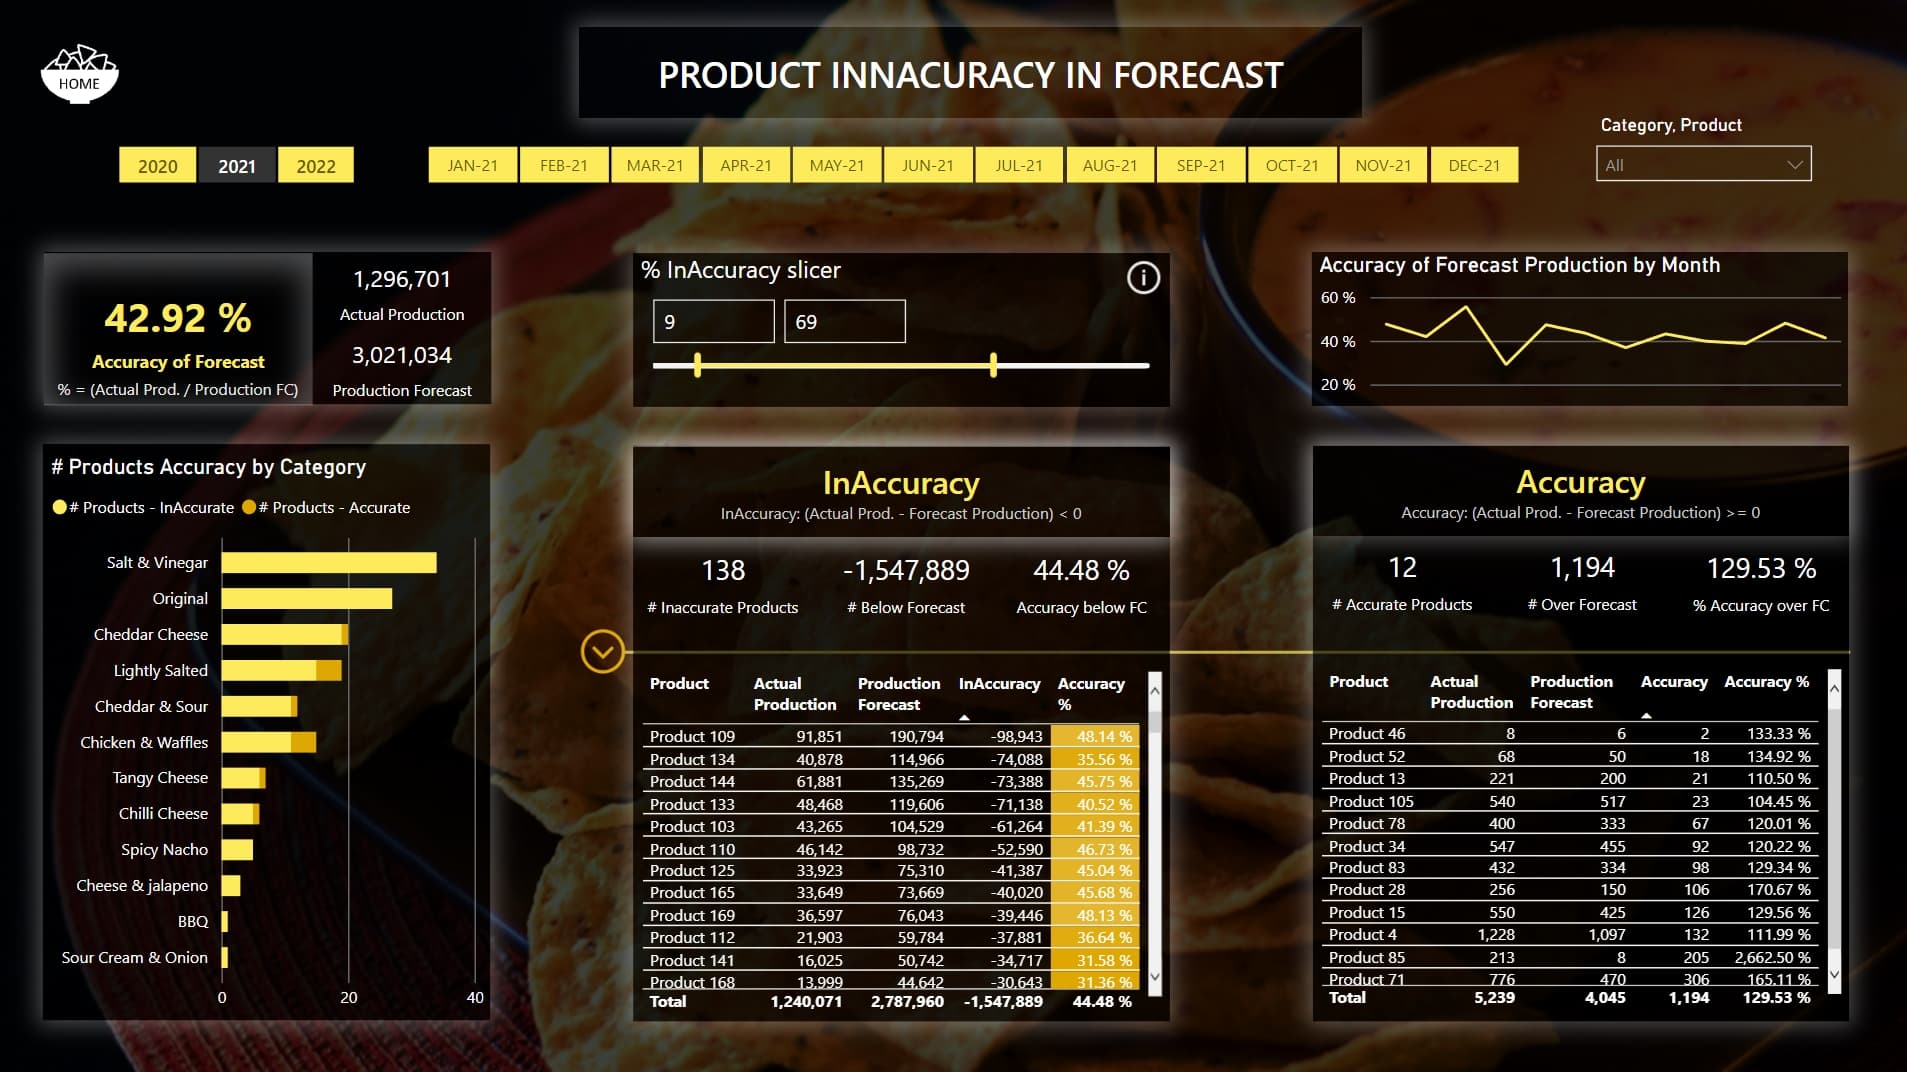
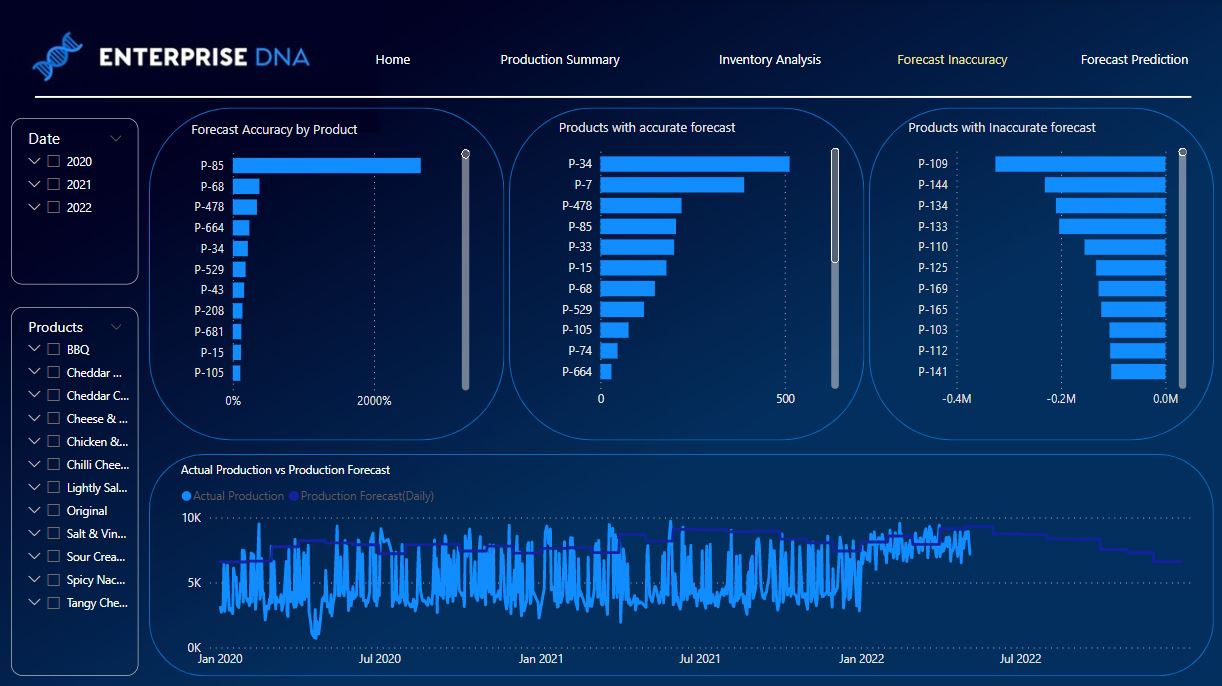
3. Product Inaccuracy in Forecast
Details
A “What if” parameter has been included. It helps the user to identify the products with a precise level of accuracy.
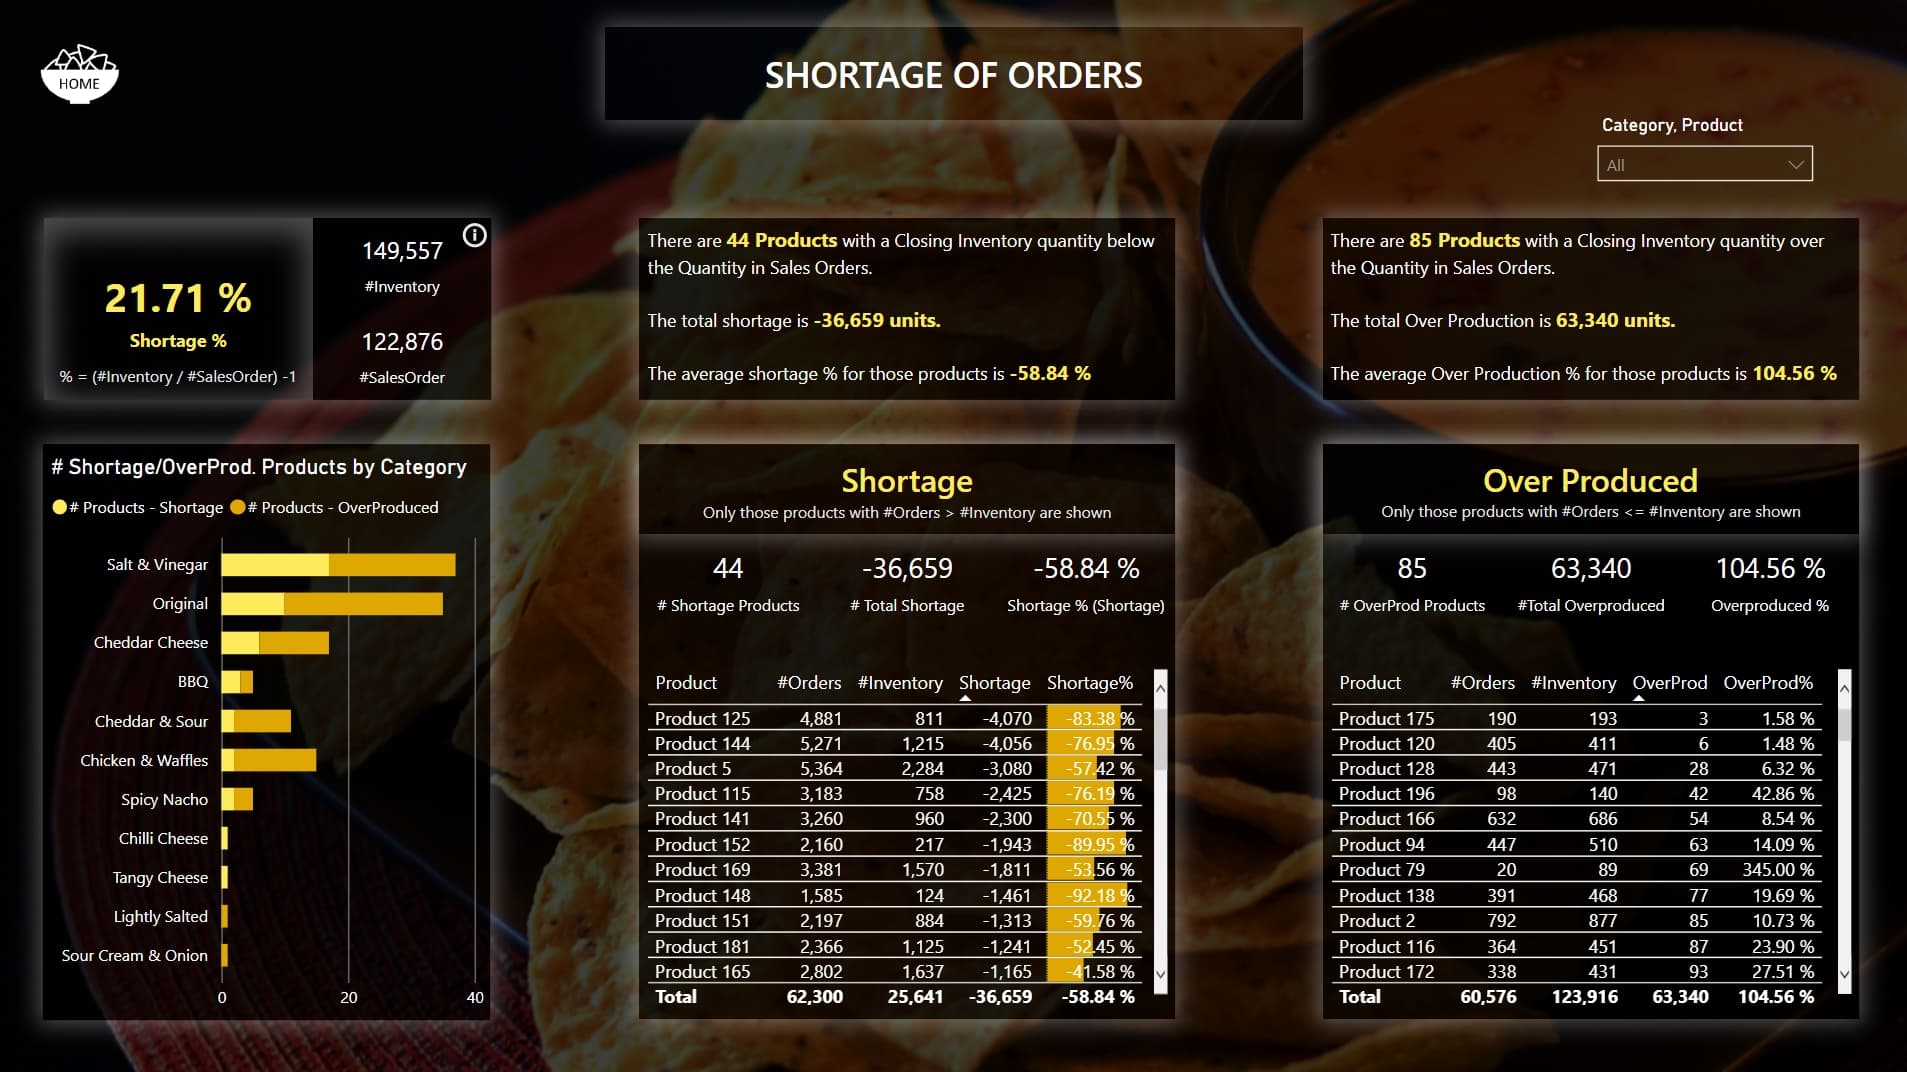
4. Shortage of Orders
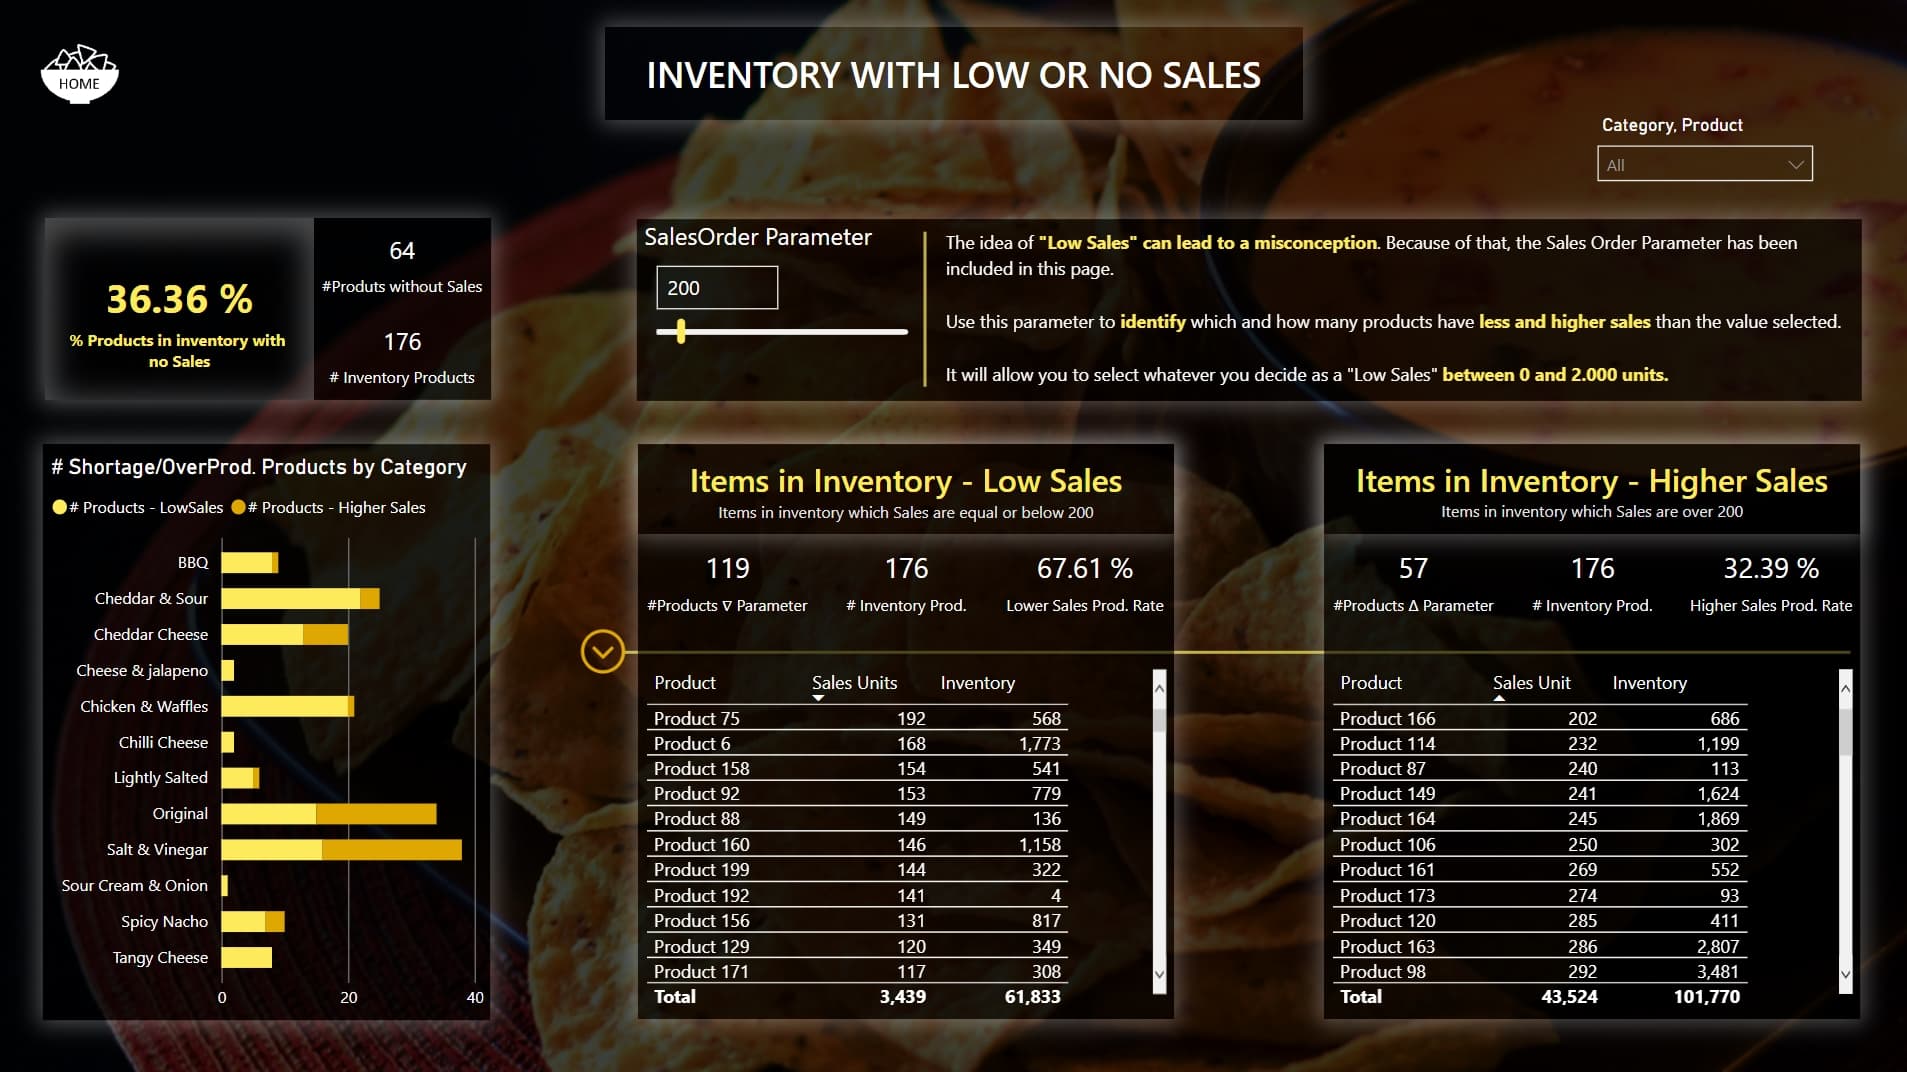
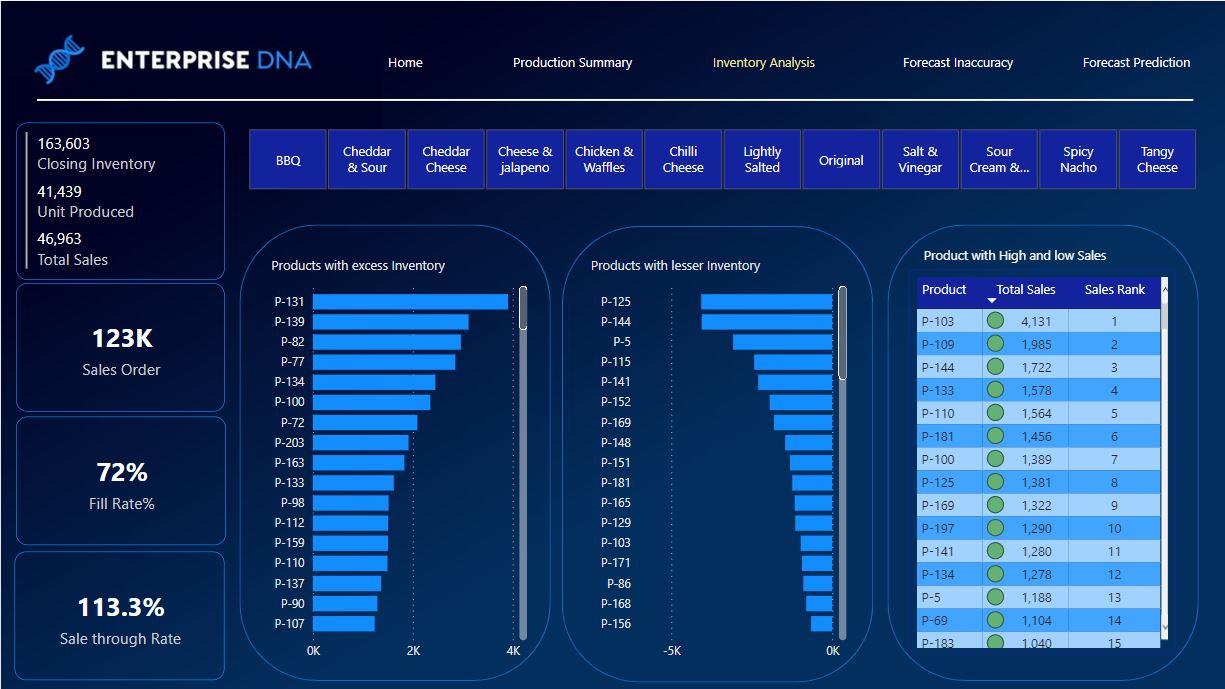
5. Inventory with Low or No Sales
Details
A “What if” parameter has been included. In this case, the user can decide whatever he decide as a “Low Sales” between 0 and 2.000 units.
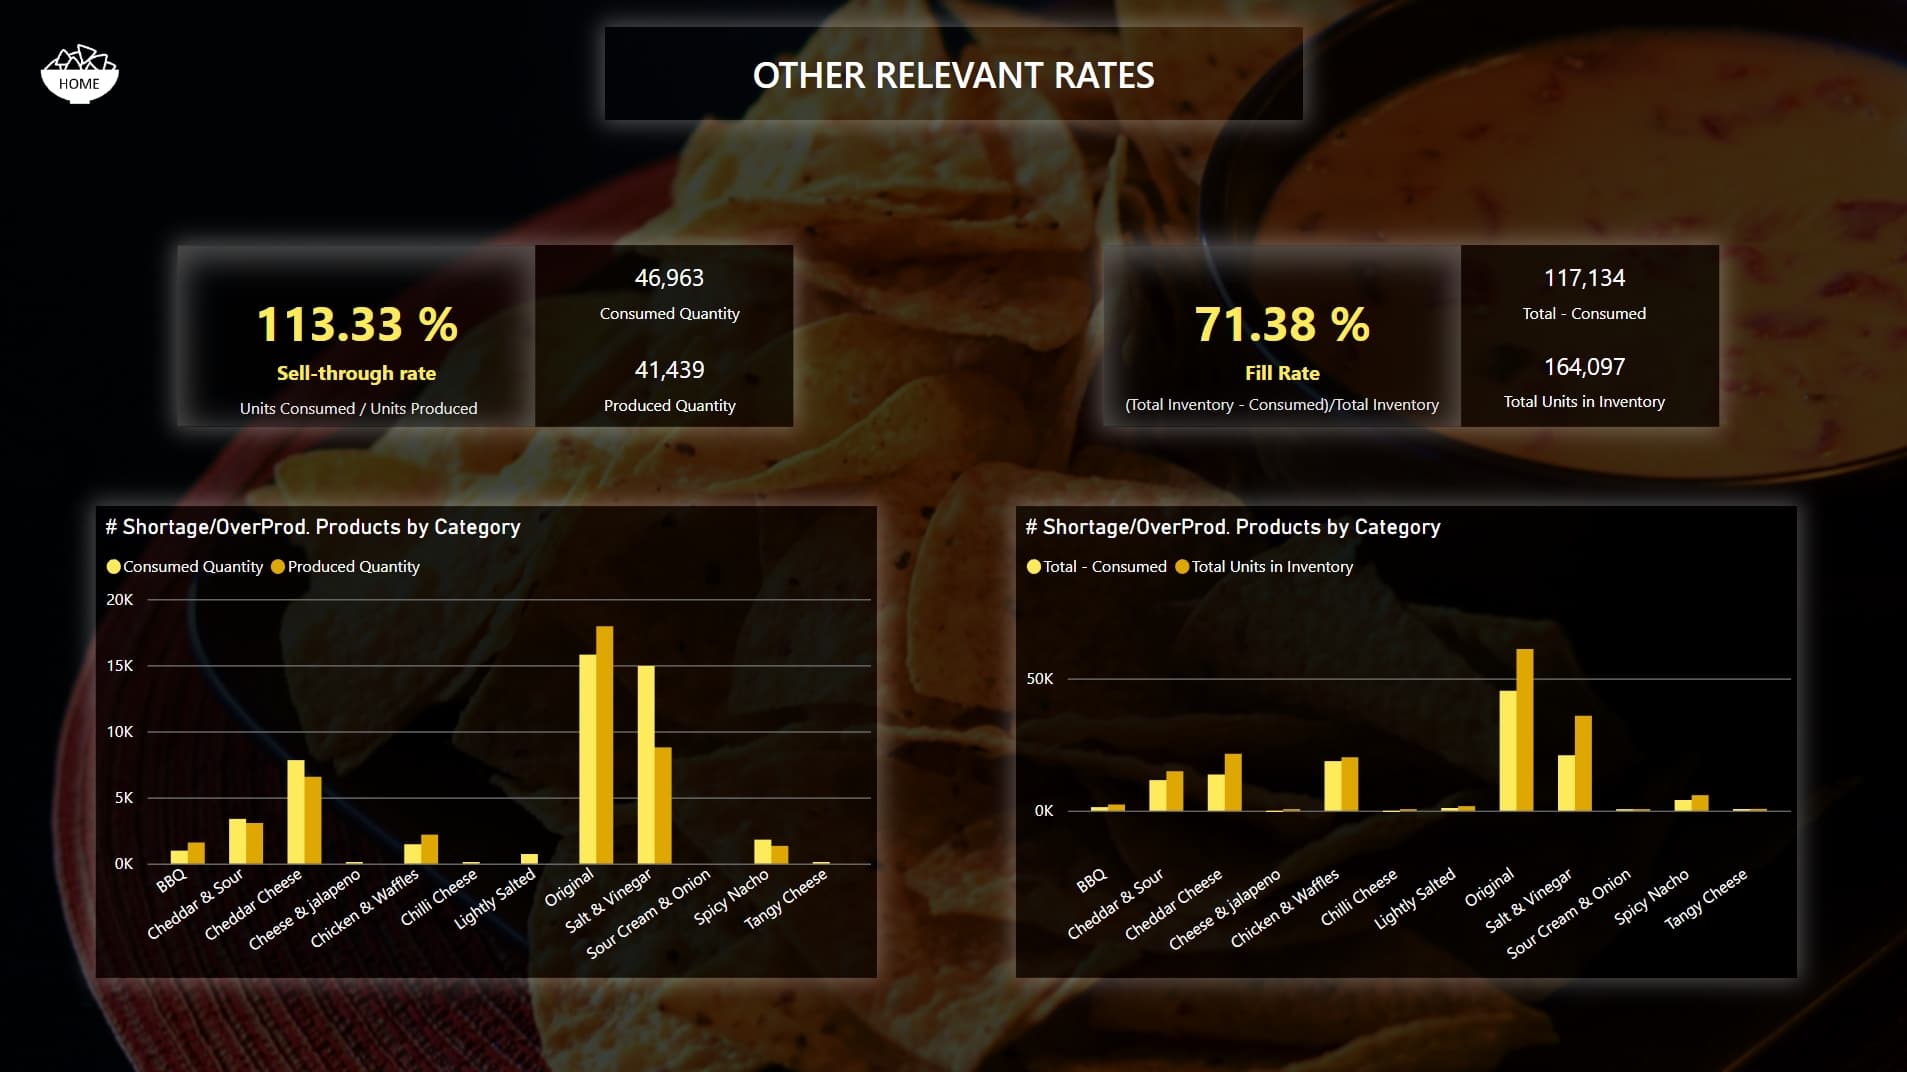
6. Other relevant Rates
Details
Sell-Through rate and Fill rate are shown in this page
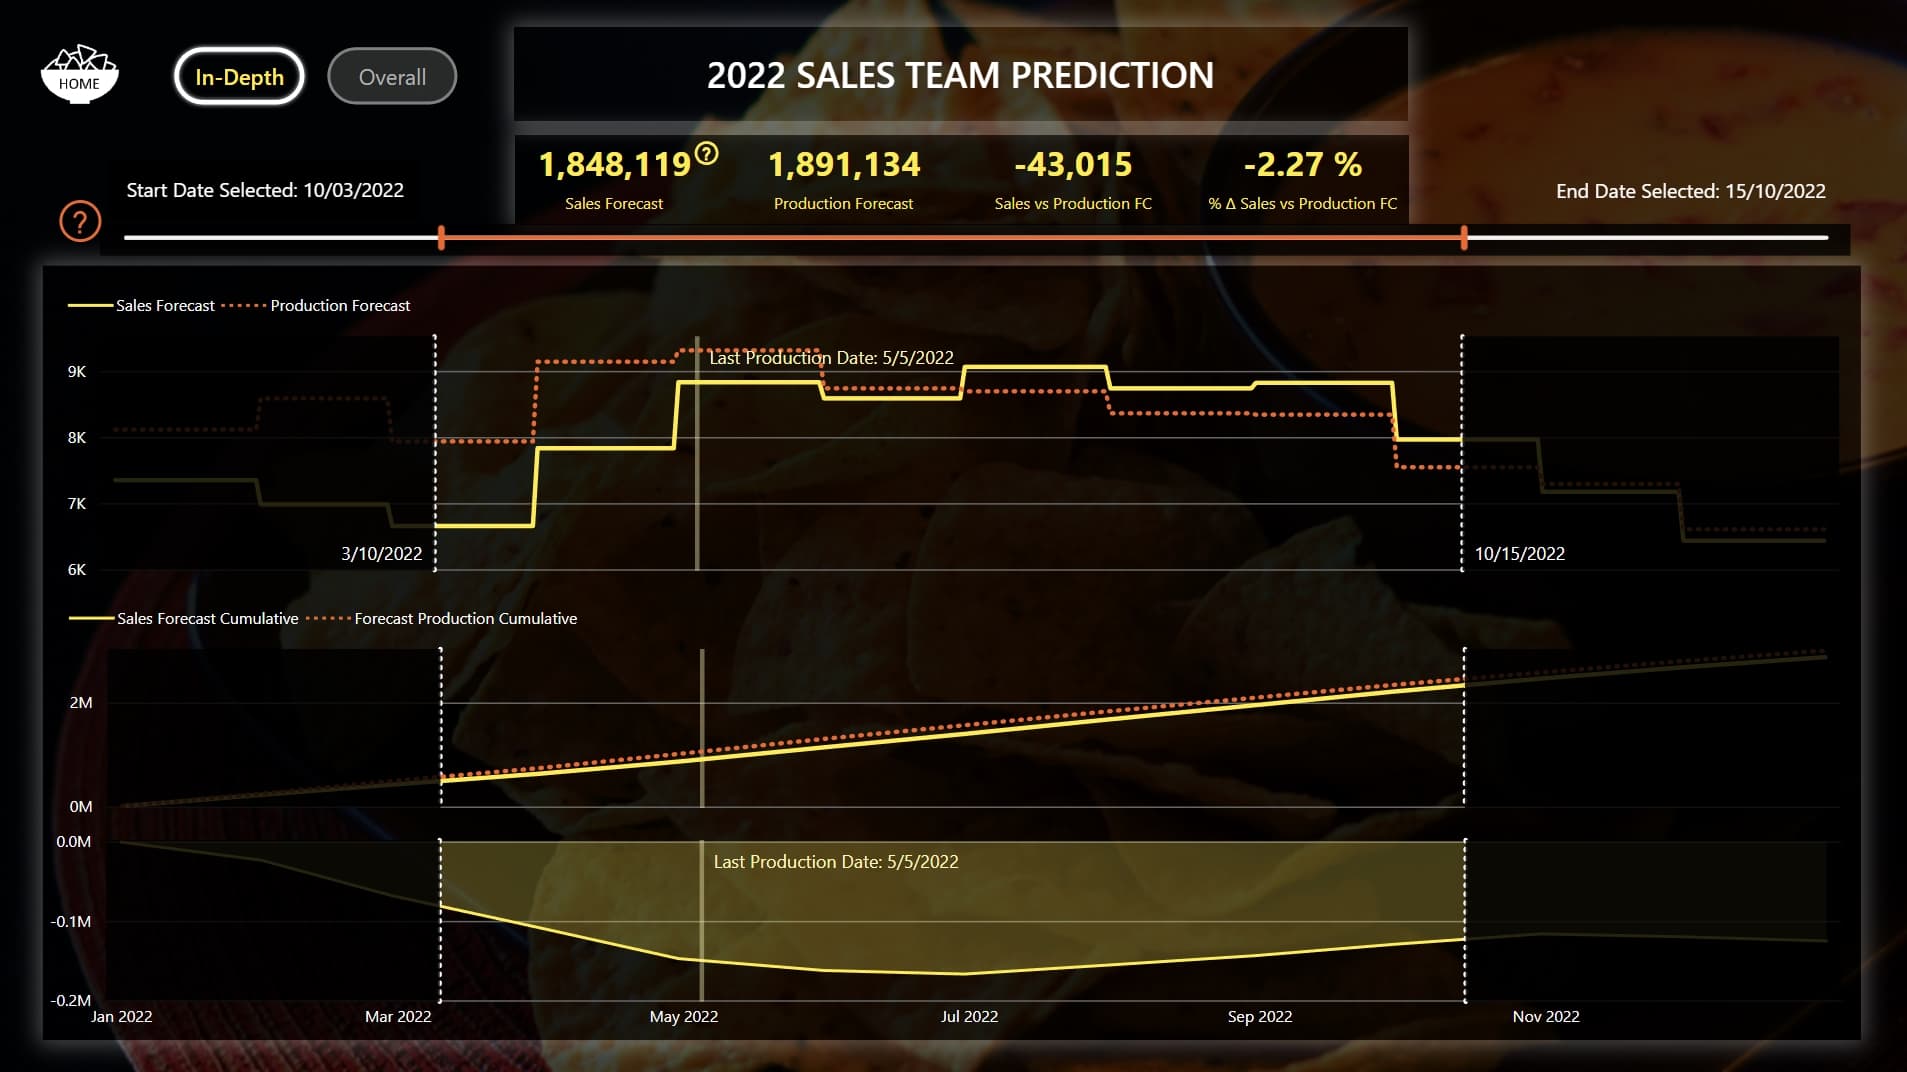
7. 2022 Sales Team Prediction
Details
Some advanced techniques have been used here:
The most visual one is playing with “Add further analyses to your visual” for the three objects displayed - Kudos to Bas from “How to PowerBI” Youtube Channel -
The other one is something that our collegue @jafernandezpuga pointed out some comments above.
As you can see in the image, I decided to break down the date from months to days. To do that, I had to watch the following video several times. Kudos to the master @sam.mckay . Extremely helpful!
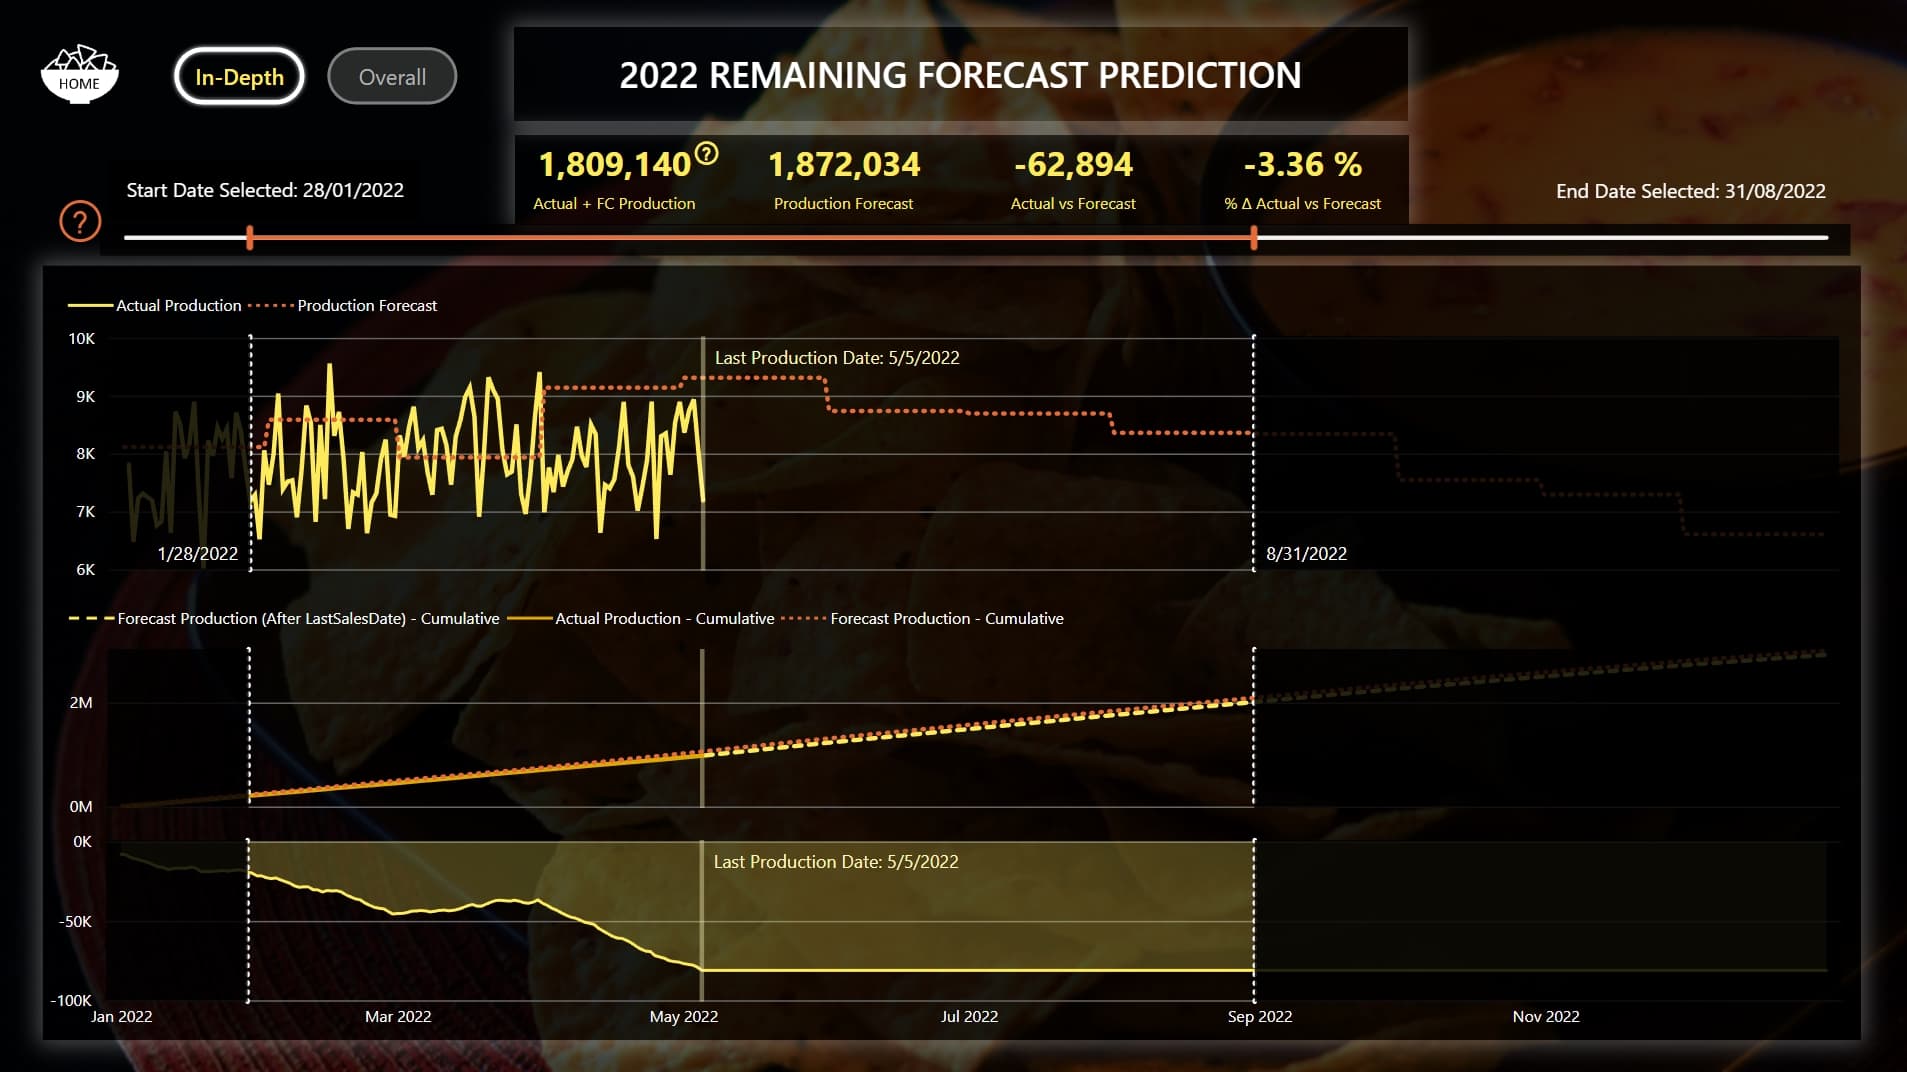
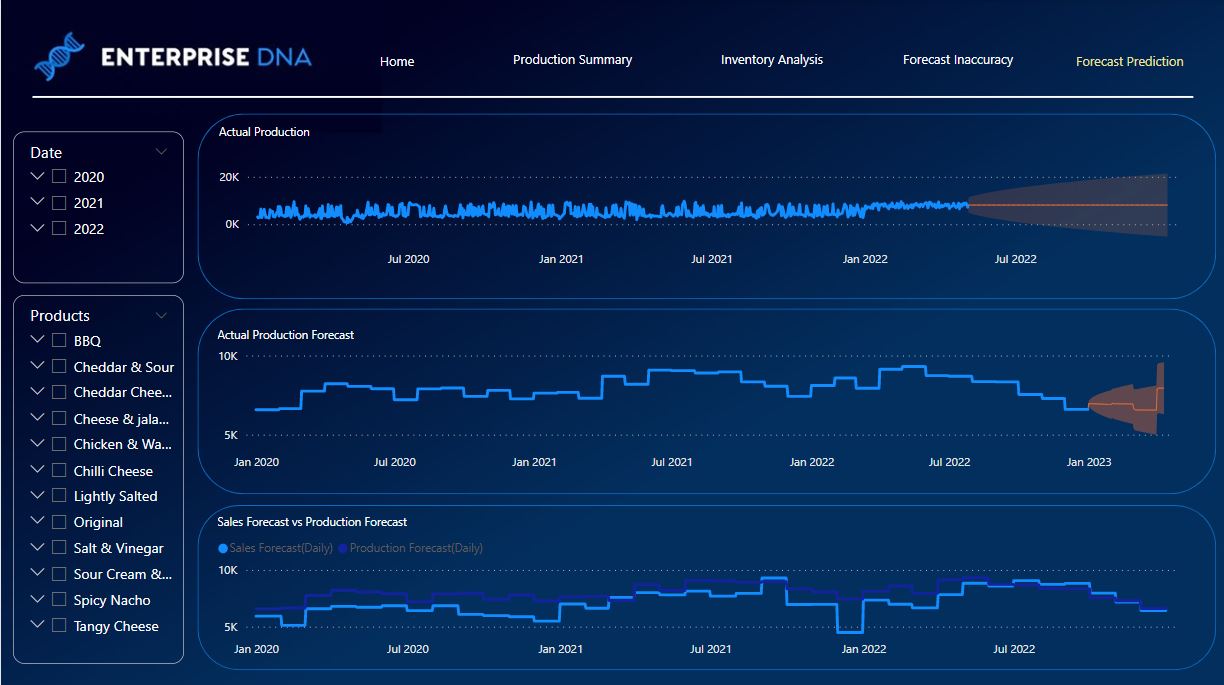
8. 2022 Remaining Forecast Prediction
Details
Here I used both of advanced techniques detailed on the previous point but, in addition, I used another advanced tecnique which I found absolutely useful. This technique is the one who allows to combine the Actual Production up to a date, and since then, you just visualize another metric (second visual object)
Kudos to Alberto Ferrari and its Youtube Channel and blog SQLBI
8 Likes
Hi everyone, this is an entry submitted by Jackie Tejwani sent to us via email.
Here’s how Jackie described it:
Hello Everyone,
I accepted the Enterprise DNA challenge.
I found this project quite challenging with having to make assumptions with the lack of some data but was able to put together something.
It’s not perfect but hopefully better.
You may view the full report here:
Jackie Tejwani
Please feel free to give Jackie your feedback on his report.
2 Likes
Hi everyone, this is an entry submitted by James jie sent to us via email.
Here’s how James described it:
Hi everyone, greetings from the Netherlands!!
I have accepted the Enterprise DNA Challenge 20 ”Sales and production Analysis from Aikeen Industries.
At times it was challenging and was struggling as well. This is my first submission of all challenges and is looking forward to learning from you all. BR, James
You may view the full report here:
James Jie
Please feel free to give James jie your feedback on his report.
3 Likes
Good evening @MudassirAli,
It would be very helpful if you could answer the question I asked a few days ago.
Thank you very much,
1 Like
As I’ve seen a couple of other participants asking. Here is my take on the Actual Production vs Production Forecast. Just need a little help to get the right “Total”.
Here is my formula to calculate the Production forecast up to the last actual production date.
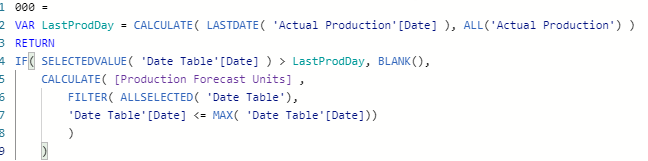
Here is the result, it looks good on visuals but not on a card! Because of the Total Row.
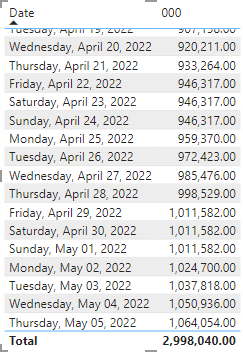
Any help, on getting the total correct will be greatly appreciated!
1 Like

2 Likes
Hi everyone, this is an entry submitted by Krishnajee Mummina sent to us via email.
Here’s how krishna described it:
Hello, Data community,
I have accepted Enterprise DNA Challenge 20 “Sales and Production Analysis”.
This is by far the toughest challenge since I started participating in Data Visualization Challenges.
The Dataset is very hard to crack and the questions are even hardest to crack. This one is not my best but tried my best with my limited time.
Thanks to Enterprise DNA and Federico Pastor for the challenge and the dataset. Really tested my Analytic skills.
You may view the full report here:
Krishnajee Mummina
Please feel free to give krishnajee Mummina your feedback on his report.
2 Likes
Hi @BernatDuran ,
I am with the part of the analysis of the inventory of finished products and when calculating the % of Fill Rate, I have seen that it does not coincide with the calculation that appears in screenshot 6. Other relevant rates ( Fill Rate = 71.38 % )
This is the calculation that I am applying:
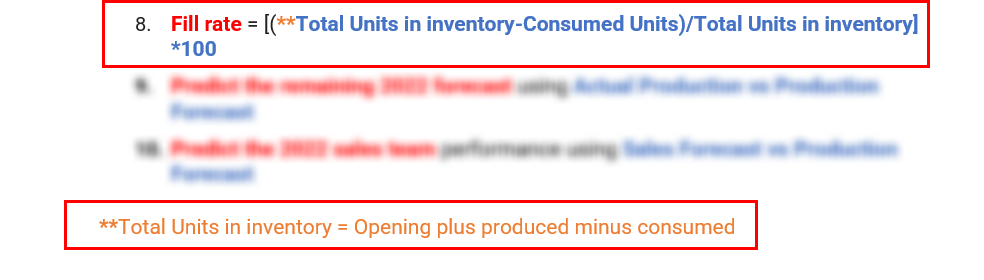
Fill rate = [(**Total Units in inventory-Consumed Units)/Total Units in inventory] *100
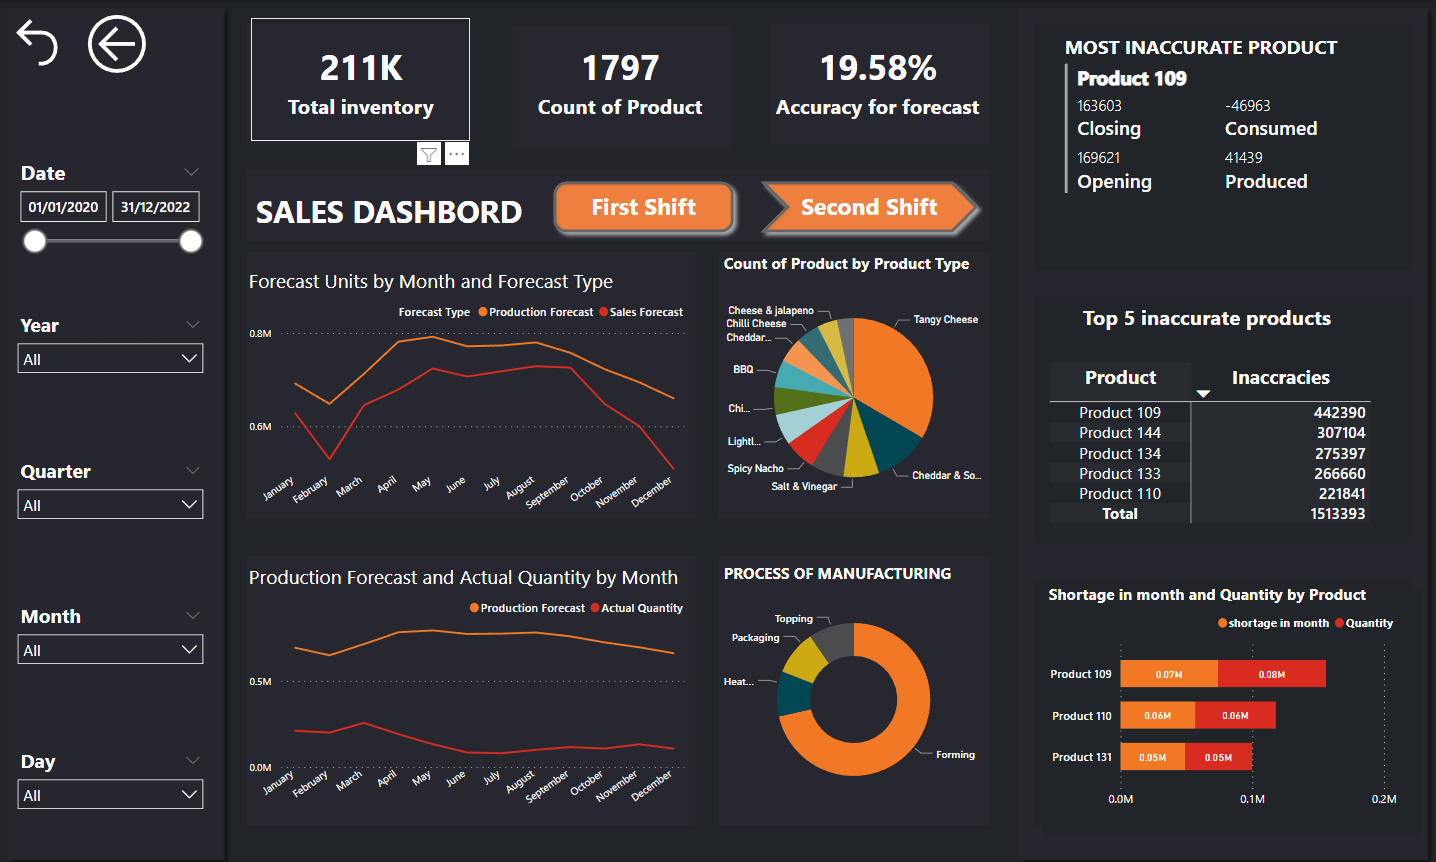
Total Units in inventory = Opening + Produced = 169,621 + 41,439 = 211,060
Consumed Units = 46,936
Fill rate = (211,060 - 46,963) / 211,060 * 100 = 77.75%
I think that in @VICENTEajm report 71% also comes out, to know why this calculation does not agree with us.
Regards
Hello everyone,
I have reached the last two questions and the following doubts have arisen.
9. Predict the remaining 2022 forecast using Actual Production vs. Production Forecast
I have seen how to predict from real historical data with the automatic option of Power BI or creating a measure to project the data of the previous year in the following one, but in this case, I don’t know what to do.
- Predict the 2022 sales team performance using Sales Forecast vs Production Forecast
Is this question not included in question 1. Sales team performance by comparing Sales Forecast to Production Forecast ?
Regards,
Hi @jafernandezpuga ,
I followed the next formula to calculate the Fill Rate %:
Opening = SUM(‘Finished Goods Inventory’[Opening])
Produced = SUM(‘Finished Goods Inventory’[Produced])
Consumed = SUM(‘Finished Goods Inventory’[Consumed]) *-1
Total units in Inventory = [Opening] + [Produced] - [Consumed]
FILL RATE % = DIVIDE ( [Total units in Inventory] - [Consumed], [Total Units in Inventory])
I did that way because of the instructions:
Hope that helps!
Hello @BernatDuran ,
I have seen that the difference is in the calculation of the units in inventory.
In the pdf of the summary that you download with the data source and in the image that @mspanic put, it comes as:
Units in Stock = Opening + Produced
While in the forum summary it is calculated as:
Units in Stock = Opening + Produced - Consumed
Let’s see if they tell us which one is correct.
Regards.
1 Like
Hi everyone, this is an entry submitted by Ruturaj Hegana sent to us via email.
Here’s how described it:
Hi everyone,
I have accepted the Enterprise DNA Challenge. 20 “Sales and Production Analysis”.
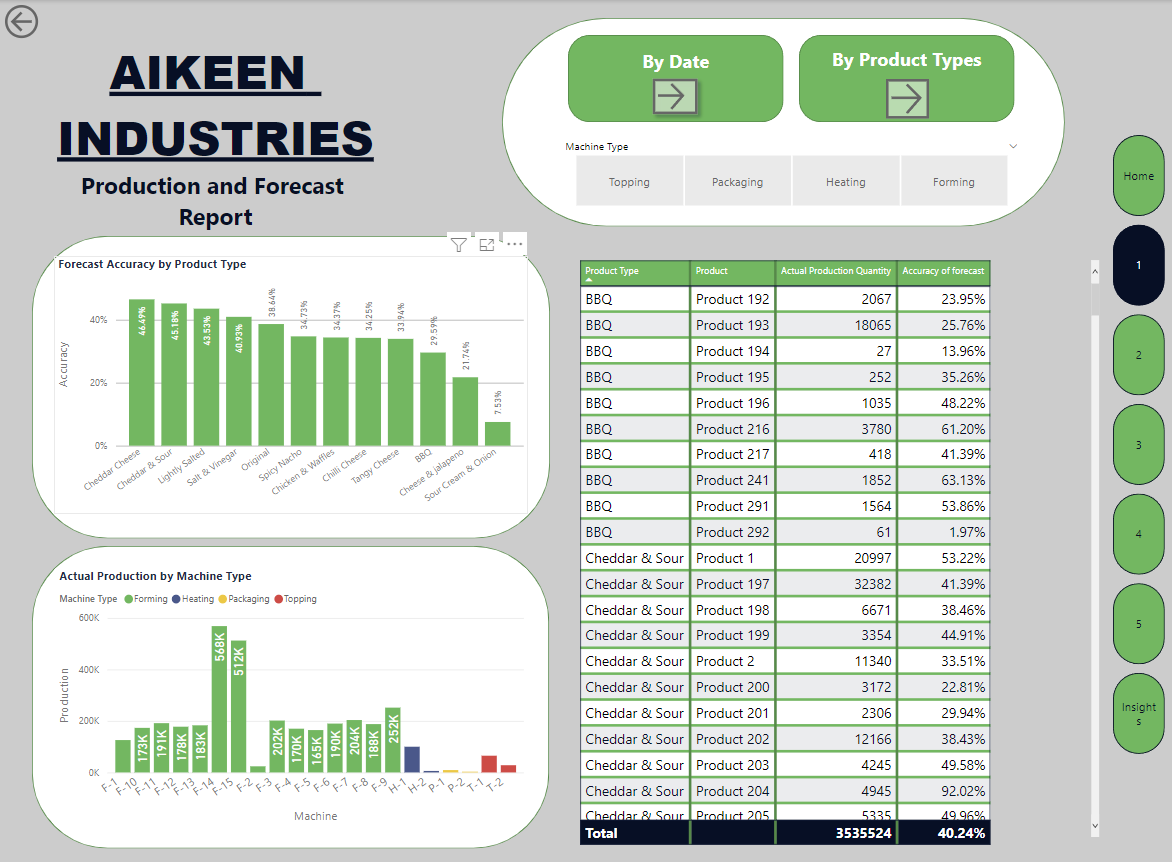
Here’s a screenshot from my dashboard.
This is my first time working on an actual dataset while going through this extraordinary challenge have learned many new things and answered all the questions. it’s a bit tough but I enjoyed it.
Thanks to Federico Pastor For doing this extraordinary challenge
and Enterprise DNA
Any recommendation for improvement will be received with open ears and eyes.
Many thanks for your suggestions.
You may view the full report here:
Ruturaj Hegana
Please feel free to give Ruturaj Hegana your feedback on his report.
Total Unit Inventory = Opeining + Produced
I entered the summary information wrongly. Sorry about it.
Please note that your ask for help quota has been all used , you have zero questions in your ask for help bag 


I hope thi helps.
Federico
1 Like
Hi everyone, this is an entry submitted by Mallik Naidu sent to us via email.
Here’s how Mallik described it:
I hope you’re all doing great.
I have accepted the Enterprise DNA Challenge. 20 “Sales and Production Analysis”.
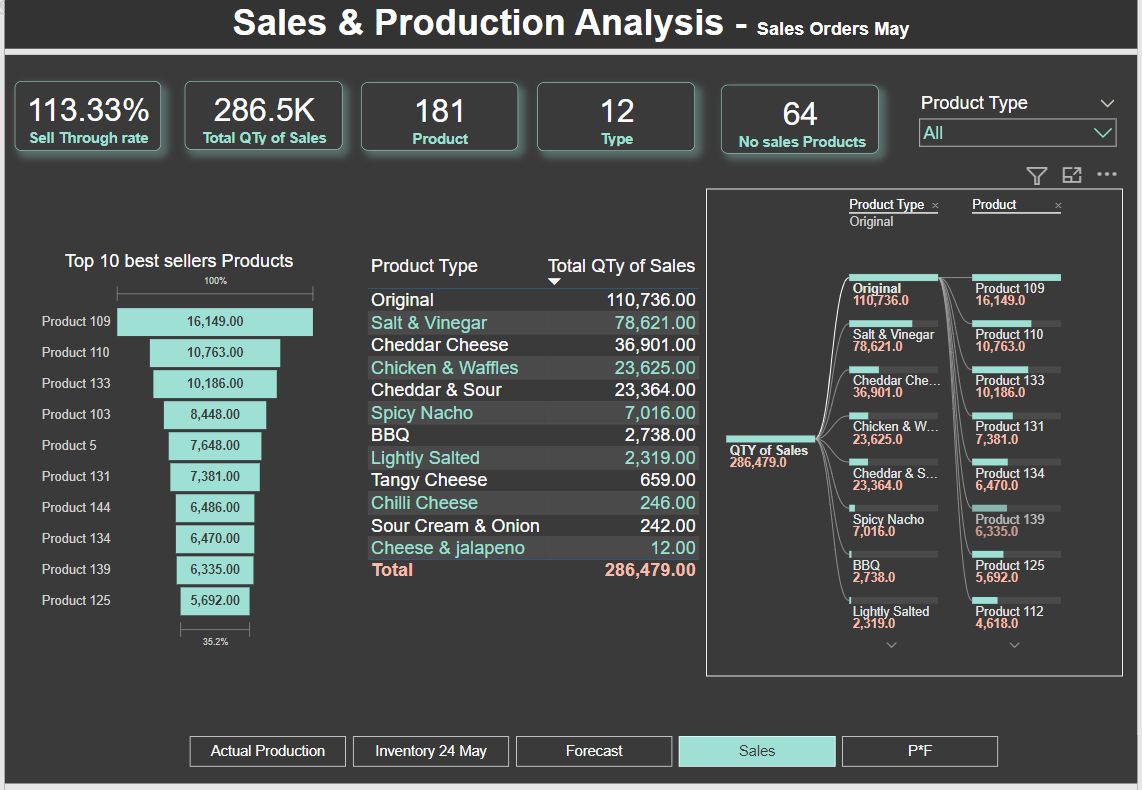
Here’s a screenshot from my dashboard.
I learned so Many DAX Functions From Enterprises DNA Articles & Blogs & Videos
A big Thanks to Federico Pastor For doing this extraordinary challenge
and Enterprise DNA
Give Me Some Suggestion To Improve My Report
You may view the full report here:
Mallik Naidu
Please feel free to give Mallik Naidu your feedback on his report.
Hi @FPastor,
This query doesn’t count, it was just to help some fellow challengers use the correct formula. 
Regards,
1 Like
Dear all,
Please find my submission below. It was loads of fun to participate and together with others here work on the Aikeen dataset. Thanks a lot for facilitating this!!!
In approaching this challenge I focused on the things that in my opinion are critical for a good report as well as were key to further practice in my personal Power BI journey.
These are:
-
Insights and recommendations - I attempted to go beyond “just sharing the numbers” and thought some good amount of time about what would be the key visuals and left out everything else (less = more).
-
Storytelling - This is where I tried to push myself again. Rather than just showing the insights, I thought of ways to add (mostly dynamic) explanatory narrative to the insights and visuals, hoping to provide context and some high level interpretation of these insights. Based on my analysis and time with the data, I believe I was able to come up with some good recommendations and next to that came up with a relative simple, but focused recommended forecasting model (considering a few variables) as input for further consideration and usage.
-
Design - Good stuff needs great packaging as well. I wanted to present this in an appealing way (this is quite subjective!
 ) and thought of other sources business leaders read and got inspired by the colors and themes Financial Times use on there website (ft.com). Next to its recognizable background color, this theme works with a nice shade of green and dark red, meaning I had to ensure my visuals were always clear - even for an audience that might have challenges on the colorblindness spectrum.
Obviously prior to this I did some transformations and data modelling and used Powerpoint for the design of the backgrounds. I’ve made quite a few visuals that didn’t make it to my end report, but were beneficial to my own understanding of the data and learning. All-in-all it was a challenge that sucked me in and got me busy for several evenings of hobbying and learning with Power BI ![]() .
.
Please go ahead and check out my live report here.
Please be so kind to let me know what you think!
Cheers, Jonathan
Enterprise DNA - Challenge 20 - Jonathan van der Waard.pdf (2.0 MB)
2 Likes
After a much thought,finally I accepted the Enterprise DNA Challenge #20.
For me, it’s a complete new experience participating in this challenge along
with expert developers and challenging dataset.
While approaching the challenge, i have divided the reports into four section
as Production summary, Inventory Analysis, Forecast Inaccuracy and Forecast
Prediction.
I tried to solve all the questions in the report and keep the minimalistic
design.
Hope to get the expert feedback on this.
Thanks and Regards,
Niraj
Power bi Challenge_20.pbix (825.2 KB)
3 Likes
Hi everyone, this is an entry submitted by Rohit Kumar sent to us via email.
Here’s how Rohit described it:
Hi everyone!
This month, I accepted the Enterprise DNA challenge, and here is my work.
It was a great experience to work on such a data set. I believe that the best way to learn something is by practicing it and meanwhile developing the skills.
I worked on this dataset for almost 10 days and added many new things to the report, which I never had worked with like using bookmarks to hide the slicer, filed parameters, and many more.
You may view the full report here:
Rohit kumar
Please feel free to give Rohit your feedback on his report.
Hi everyone, this is an entry submitted by Maha Koutb sent to us via email.
You may view the full report here:
Maha Koutb
Please feel free to give Maha Koutb your feedback on her report.
1 Like