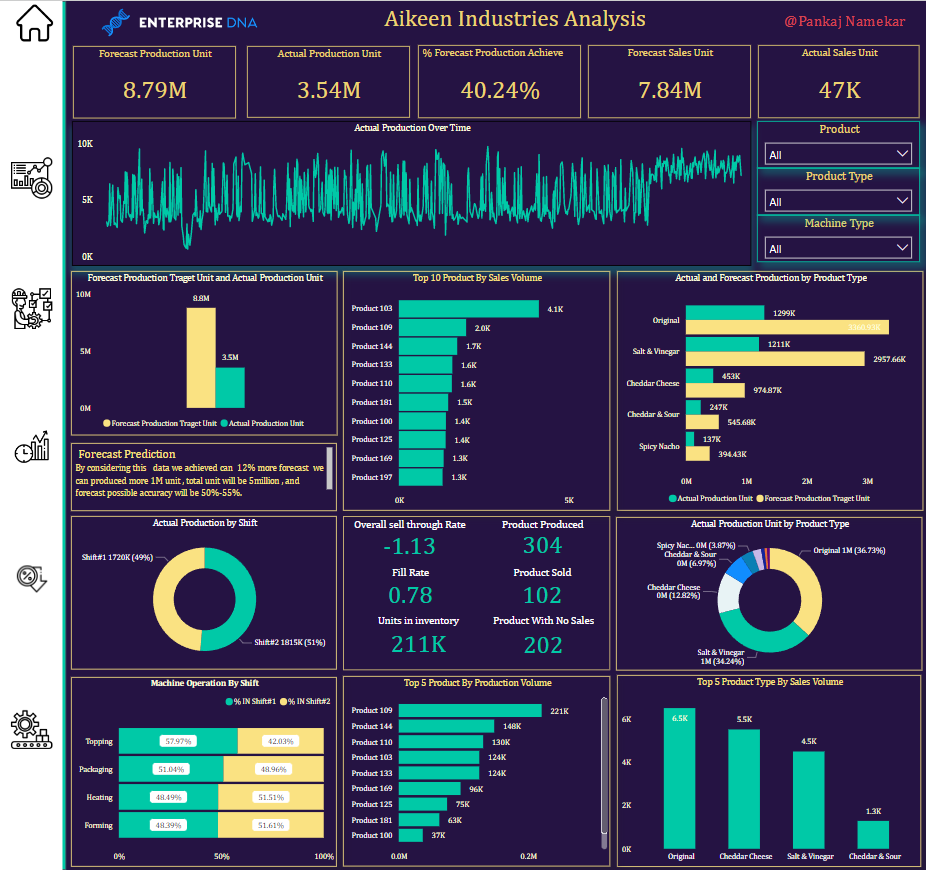
Most challenging thing for me . in short before performing an analysis of any industry you must have deep knowledge about that business.
Without proper understanding you are not able to generate proper insights.
Must have knowledge about
1-Key business area.
2-Business Pain.
3-How business operate
4-Factror affecting on business
5-Performamce in various area.
Hey everyone as we count down to the end of data challenge 20, we understand that the data complexity might take everyone too much time to work on it. So please read below announcement:
Hi,
New to the challenge and I’d like to ask a few questions to ensure my understanding is correct.
Is it fair to assume the sales team forecasts first and then the production team forecasts as a response to this? (so in case of major differences this potentially is a miscalculation of the production team?)
I assume new Sales can come in every day and then based on inventory and existing forecasts for this month it is decided whether to change the actual production or not, correct?
(but the sales forecast or the production forecast for that month stay untouched in that scenario?)
I noticed the performance of the machines varies. Do all machines of a particular type have the same potential capacity (meaning according to the supplier, it is possible to produce X products a day)?
Thanks in advance for taking the time to look into these!
You are correct that it is not necessary to compare the information of Sales Order with Finished Goods table.
Finished Goods inventory was obtained on 5th May 2022 and I believe the date in Finished Goods table is inaccurate (it should be 5/5/2022). Sales order and Finished Goods both reports were run on 5th May and these are run on a daily basis.
No need to validate the closing quantity by calculating opening plus produced minus consumption as there always are inventory adjustments during inventory cycle counts that’s why in most of the cases, the calculation is not equal to the closing quantity.
Sales forecast is the budget that is set in the prior year and never changes during the year. Production forecast is also done by sales team but it changes quarterly and sometimes monthly (especially after COVID) based on different factors (loss of customers, seasonal demands, new customers etc.). You can say that Sales forecast is a long term forecast whereas production forecast is the short term forecast.
Yes, sales orders report is run on a daily basis and new sales come in every day and actual production is adjusted accordingly.
That’s again correct. All the machines have different capacities and the output also varies accroding to different products.
Hi @MudassirAli, thanks for the quick turnaround. Fully clear on 1 and 2. Thanks!
OK, just double checking we understand each other on the 3rd one.
I thought for example machine F-10 and F-11 should potentially be able to produce the same.
Obviously they haven’t produced exactly the same amounts over the past years, but I was wondering if I could come with insights about how efficient a machine is and compare machines.
But that is only possible if the potential is the same and I hence can compare apples with apples, meaning similar machines of the same machine type.
If the potential is different for each machine, then I guess we can’t say much on this route (something I thought of exploring). Right?
You are correct… There are no good insights to be extracted by comparing the machines… It could have been useful if we were analyzing the bottlenecks on the machines. As for some background information, machines are made in such a way that with some minor adjustments, many products can be run on different machines if a particular machine is fully booked.
Hello group, good morning in advance greetings to all.
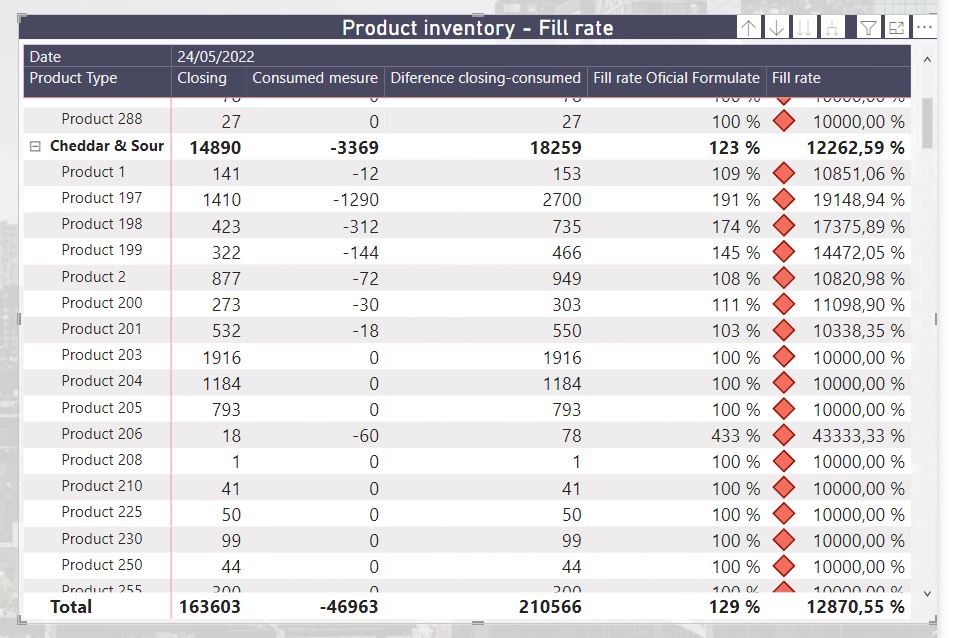
This is my first message I need help with challenge number 20 since in the inventory the calculation of the fill rate gives me amazing percentages since the consumed are in negative and according to the information the consumed are the sold then when generating the formula of the ratio of filling is as in the image if you could help me or give me ideas to know where I am failing it would be wonderful
Hi @VICENTEajm ,
What formula are you using to calculate the last column?
I see that in the penultimate column there is already the fill rate and it coincides with my calculations.
After reviewing the calculation I think we should multiply the Units Consumed by -1 or add them to the total number of units in the inventory since they are negative.
Fill Rate = DIVIDE( ( [Total Units in Inventory] - ( -1 * [Total Consumed] ) ), [Total Units in Inventory] )
hello jafernandezpuga thank you very much for your explanation, but in the request for questions
Fill rate = [(**Total Units in inventory-Consumed Units)/Total Units in inventory] *100 that was my doubt but when the inventory is made it is in the penultimate column… in conclusion I remain calm because we are doing well… now well what you say about the negatives is allowed to apply it.
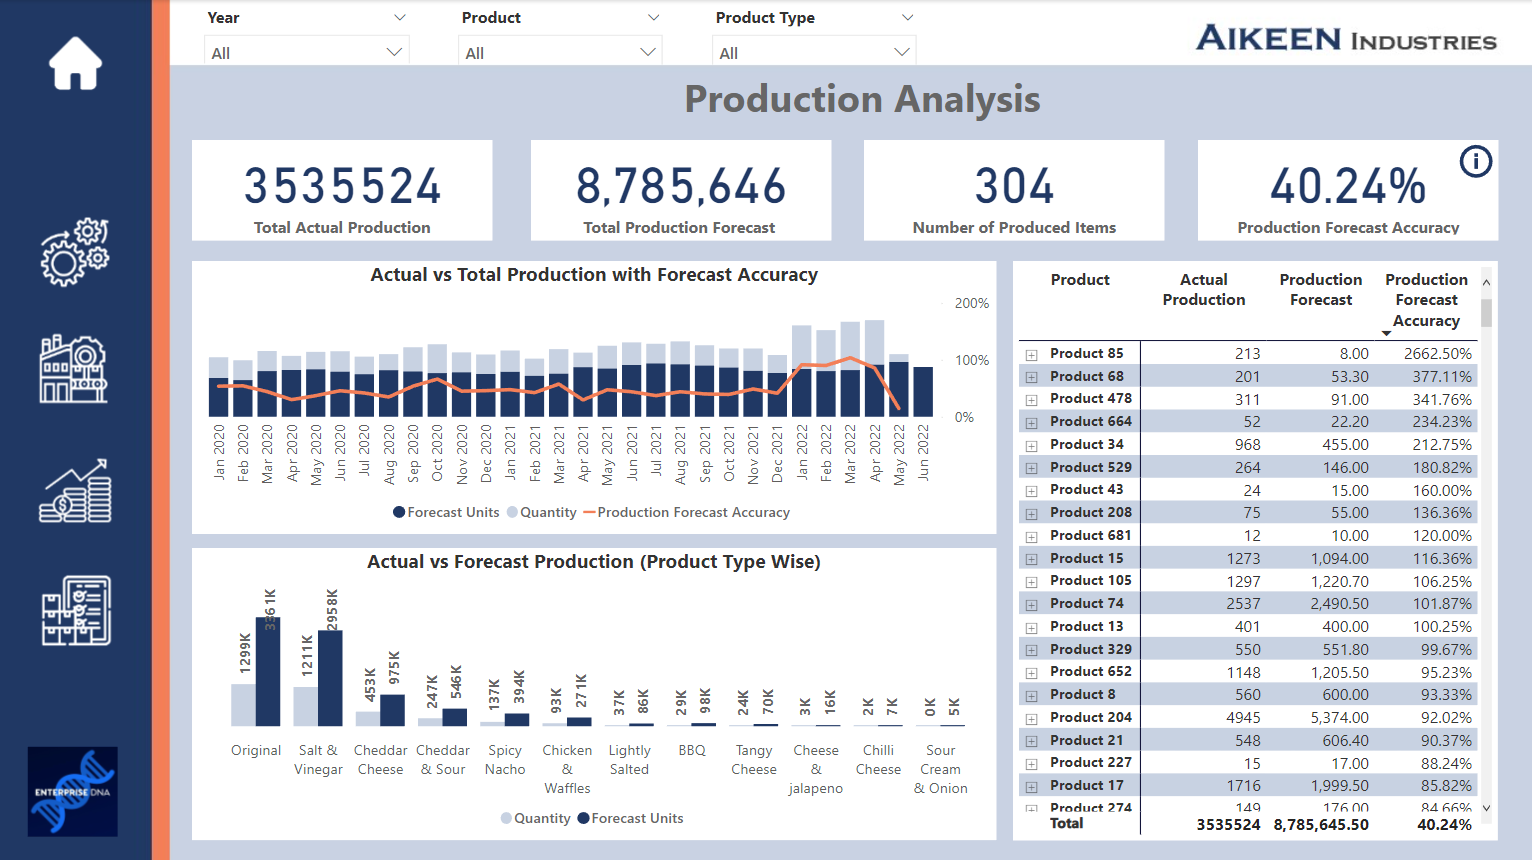
Hi everyone, this is an entry submitted by Michael Dunn sent to us via email.
Here’s how Michael described it:
Hello everyone. I have just completed my first DNA Enterprise challenge. Thank you to everyone involved, I learned lots of new skills whilst working on my entry.