Builds 20 - Sales & Production Analysis

Hi everyone, this is an entry submitted by Afolashade Allinson sent to us via email.

Here’s how Afolashade Allinson described it:

PATTERNS AND FINDINGS FROM THE DATA SET PROVIDED

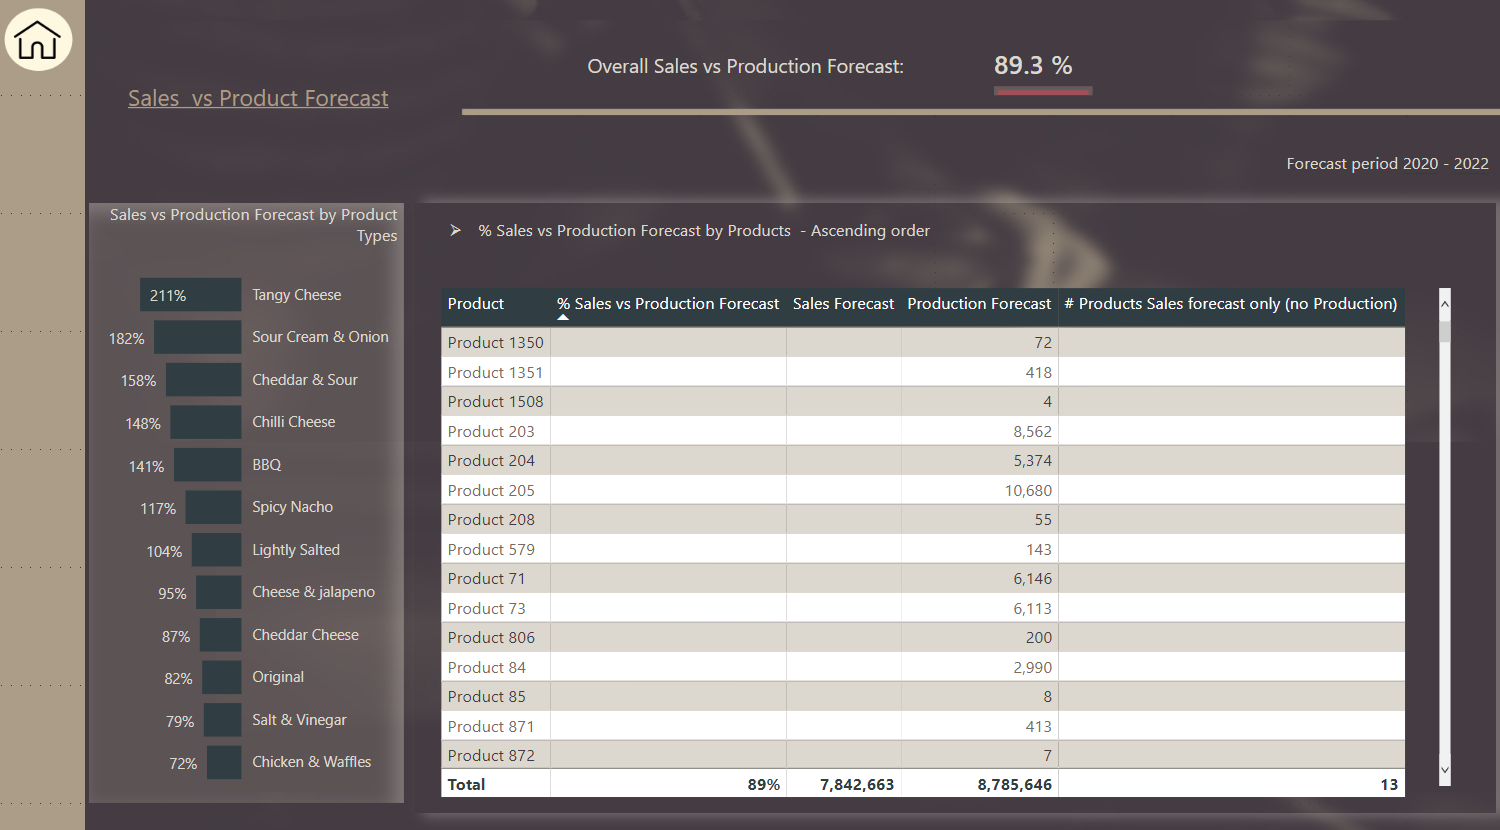
Both sales and production forecasts are of great importance in running any business. Having a crystal-clear vision of what to anticipate in the future will help the organization with planning ahead and ensuring sufficient production to equate with the demands of the market. Looking through the data provided the following were observed:

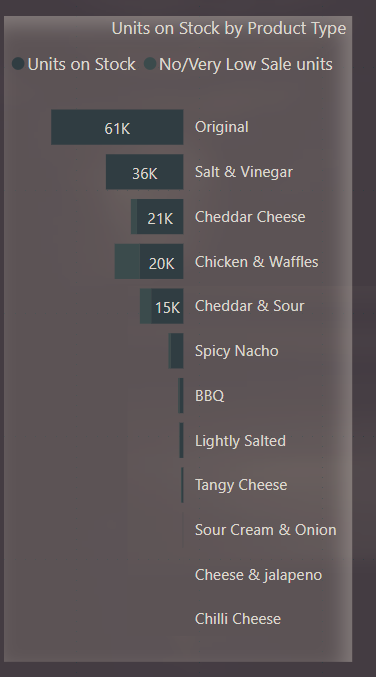
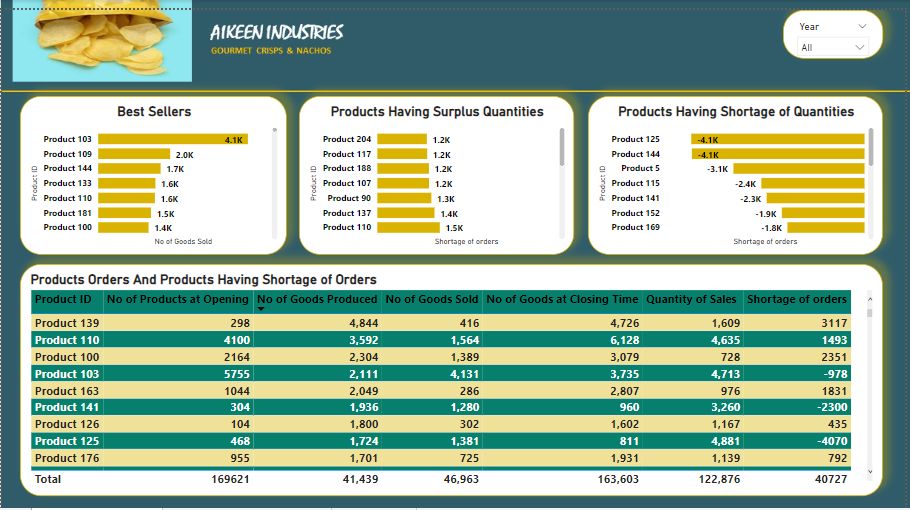
Best Sellers Products

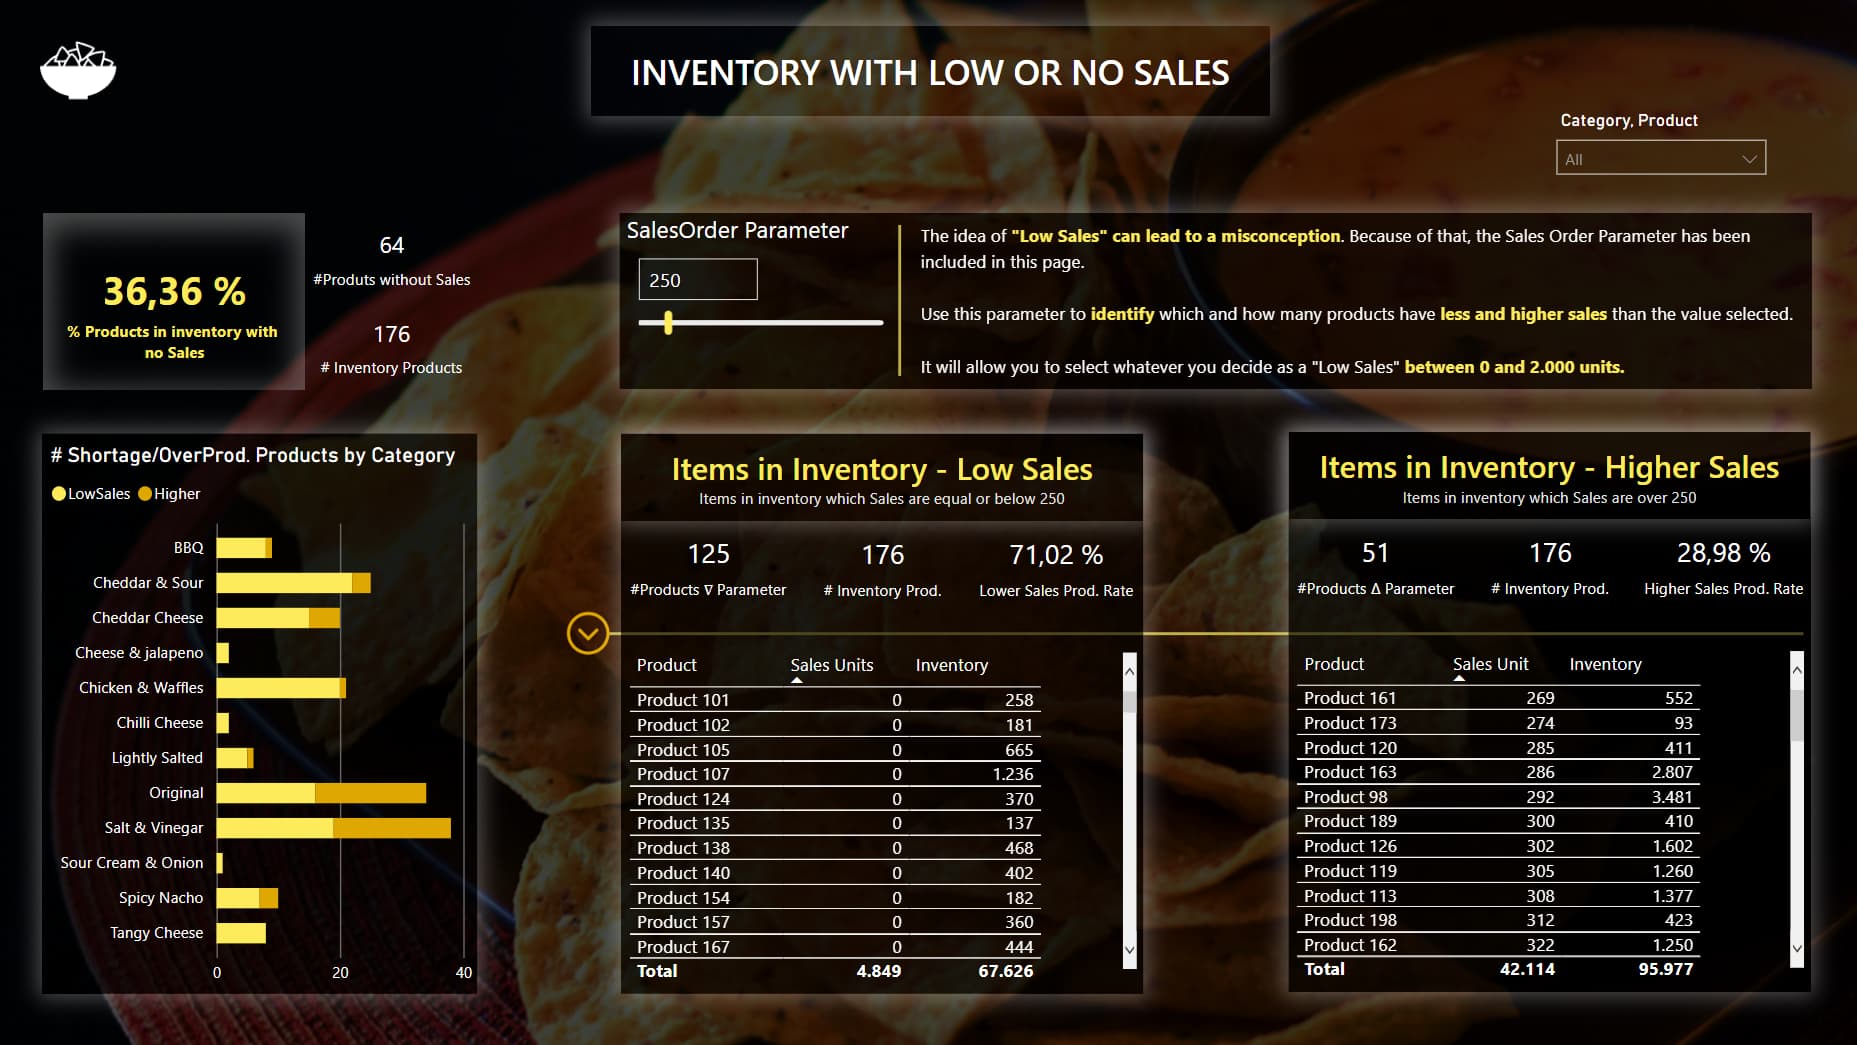
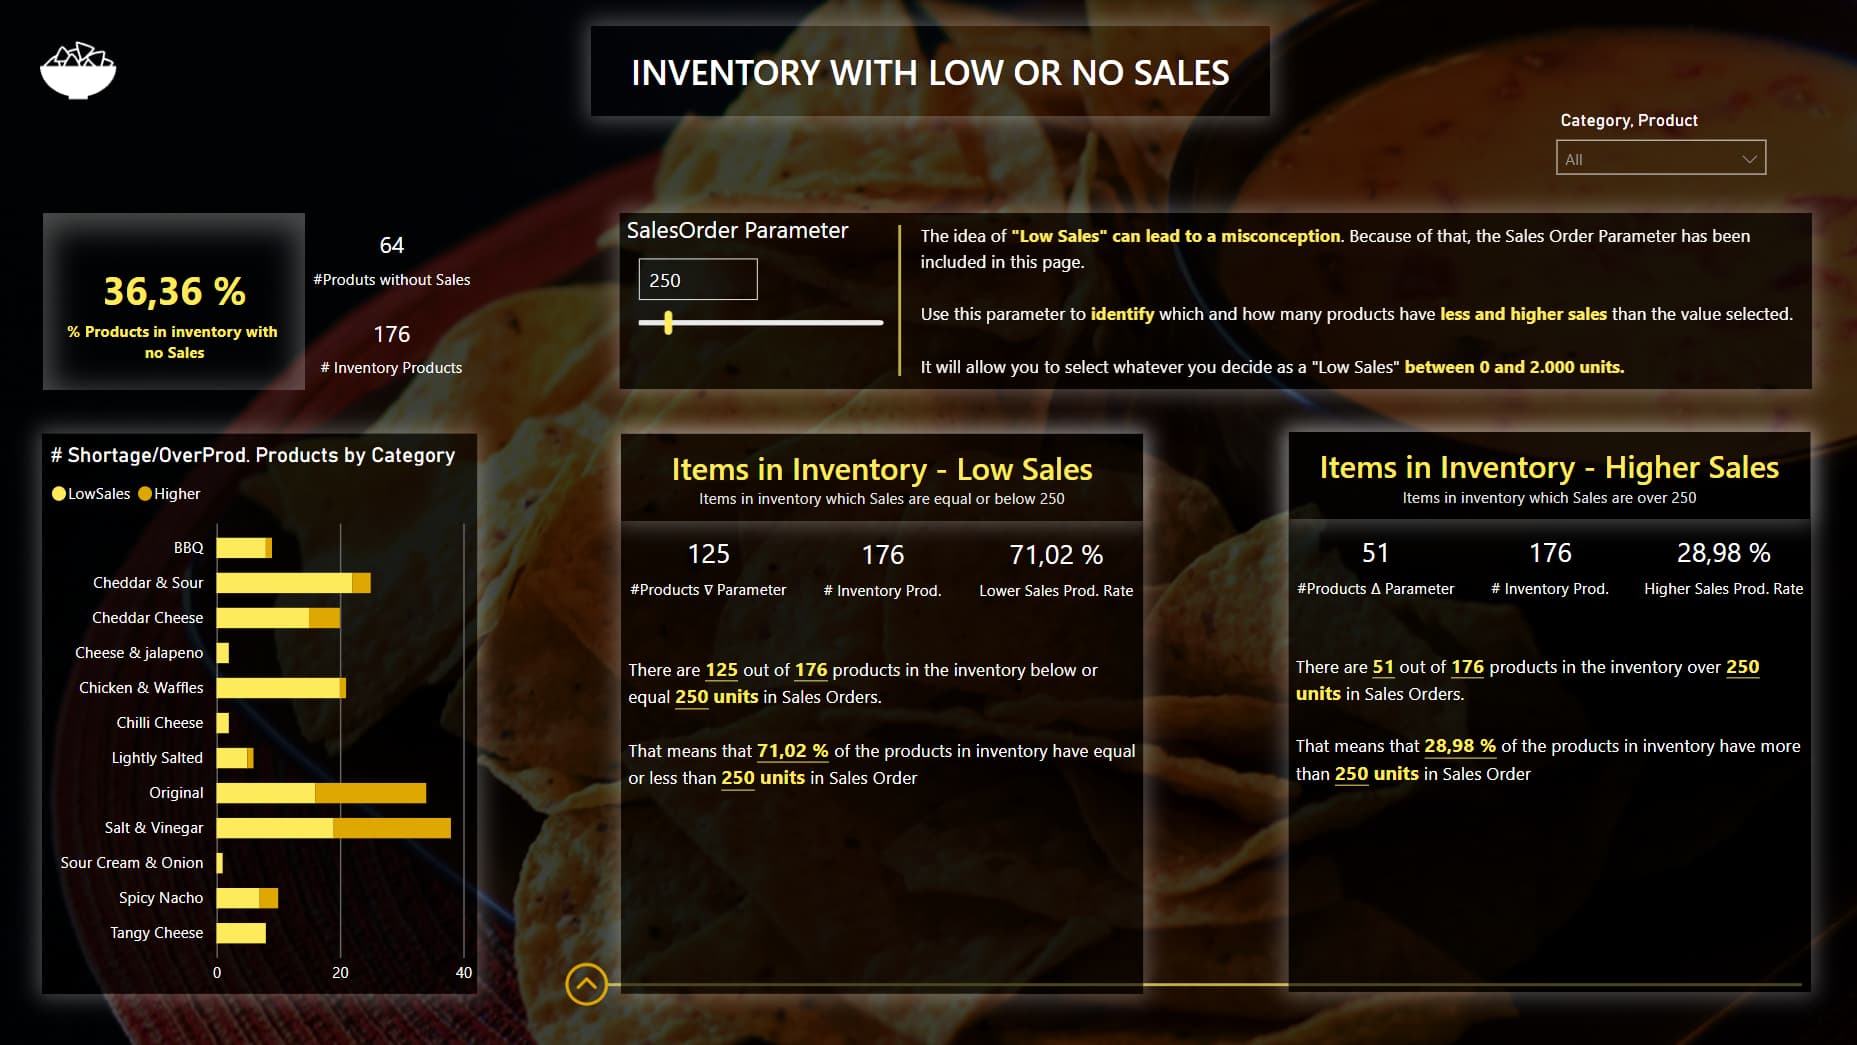
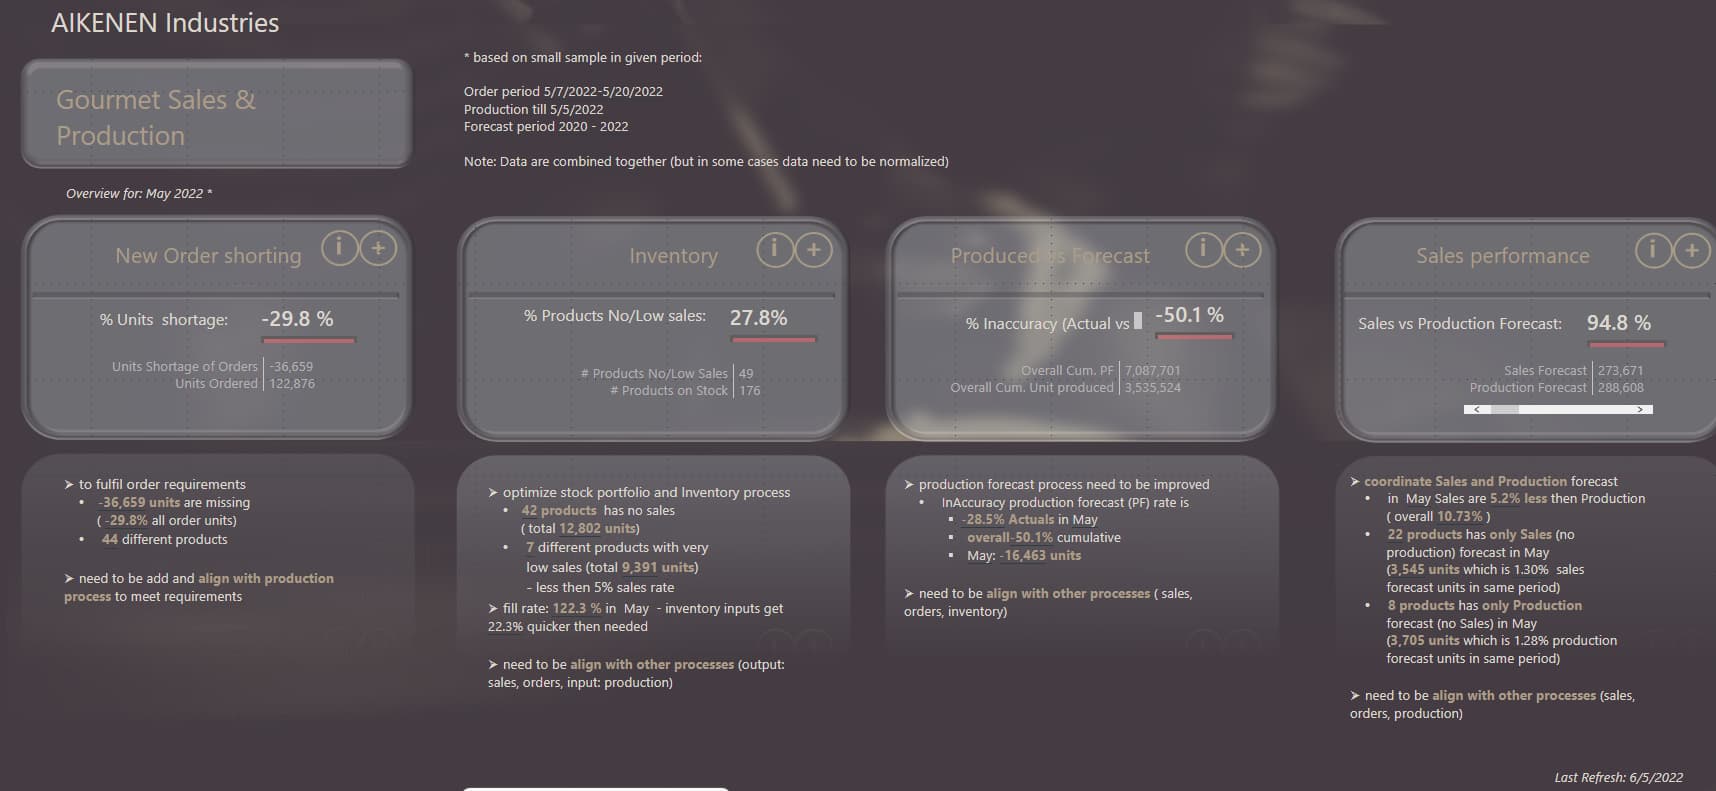
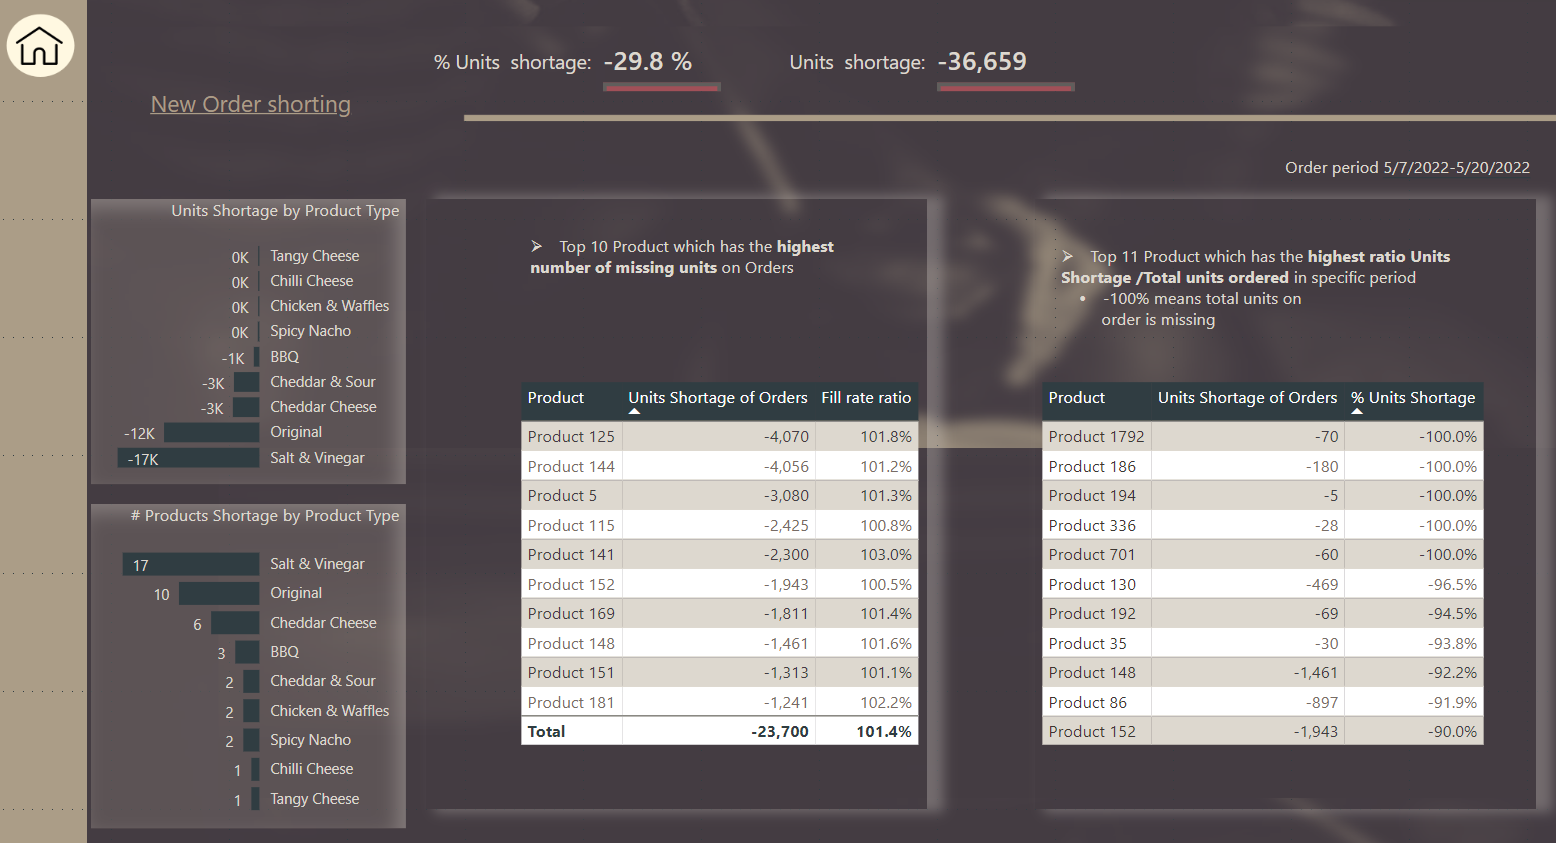
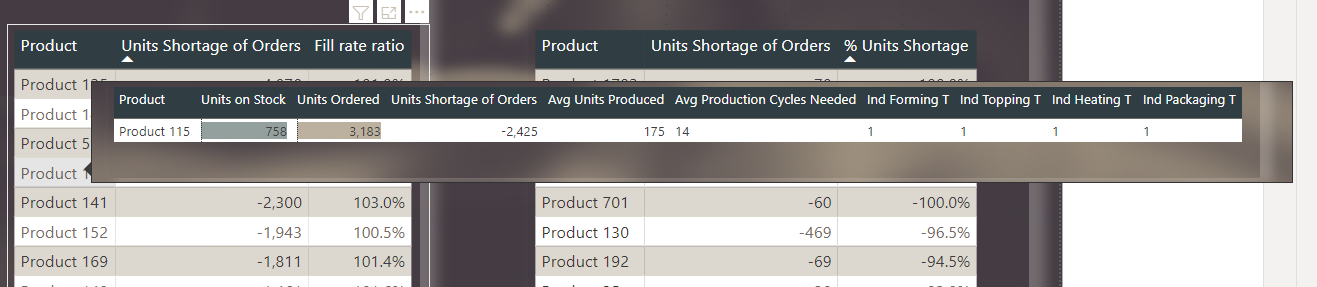
Best seller products for example, Product 103 is at shortage as of the last day of inventory. Product 103 as of May 24, 2022, was 978 units short based on sales order made. Generally, Shortage of order is at 33.14 percent and should be reduced to zero. Fill- out rate of products is at 0.78 which means if not increased there will be continuous shortage of products of items that are in strong demand.
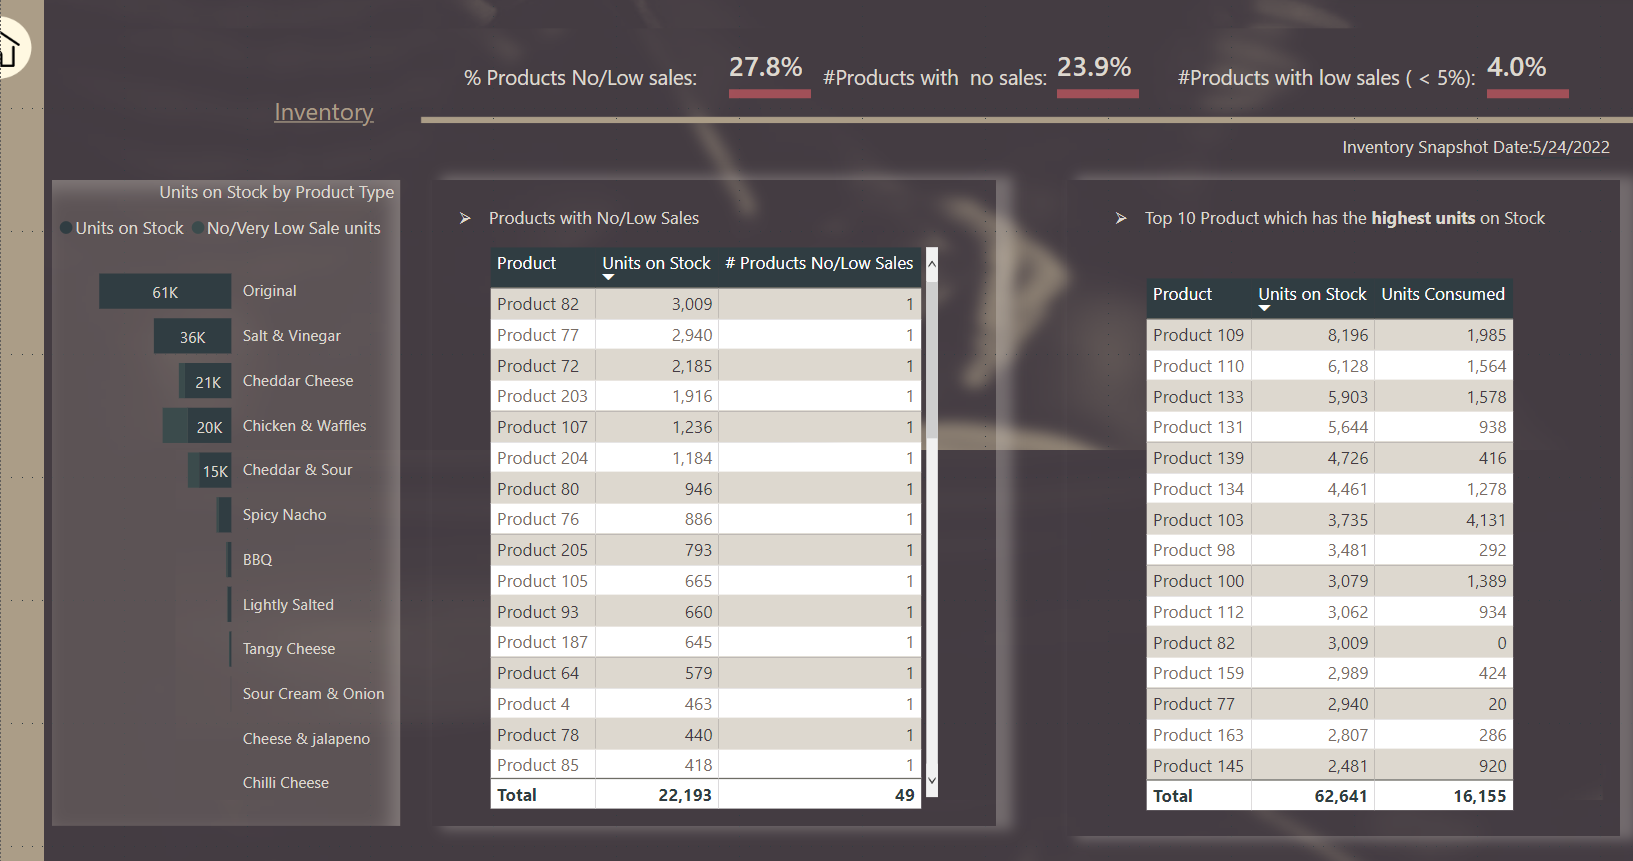
Excess quantities

Some products have excess quantities meaning a large number are available in stock but demand for them is low hence will incur cost of storage. Having high production of less demanded products means the company must stock excess production in inventory, detaining payment and increasing cost of storage.

Accuracy of Production Forecast

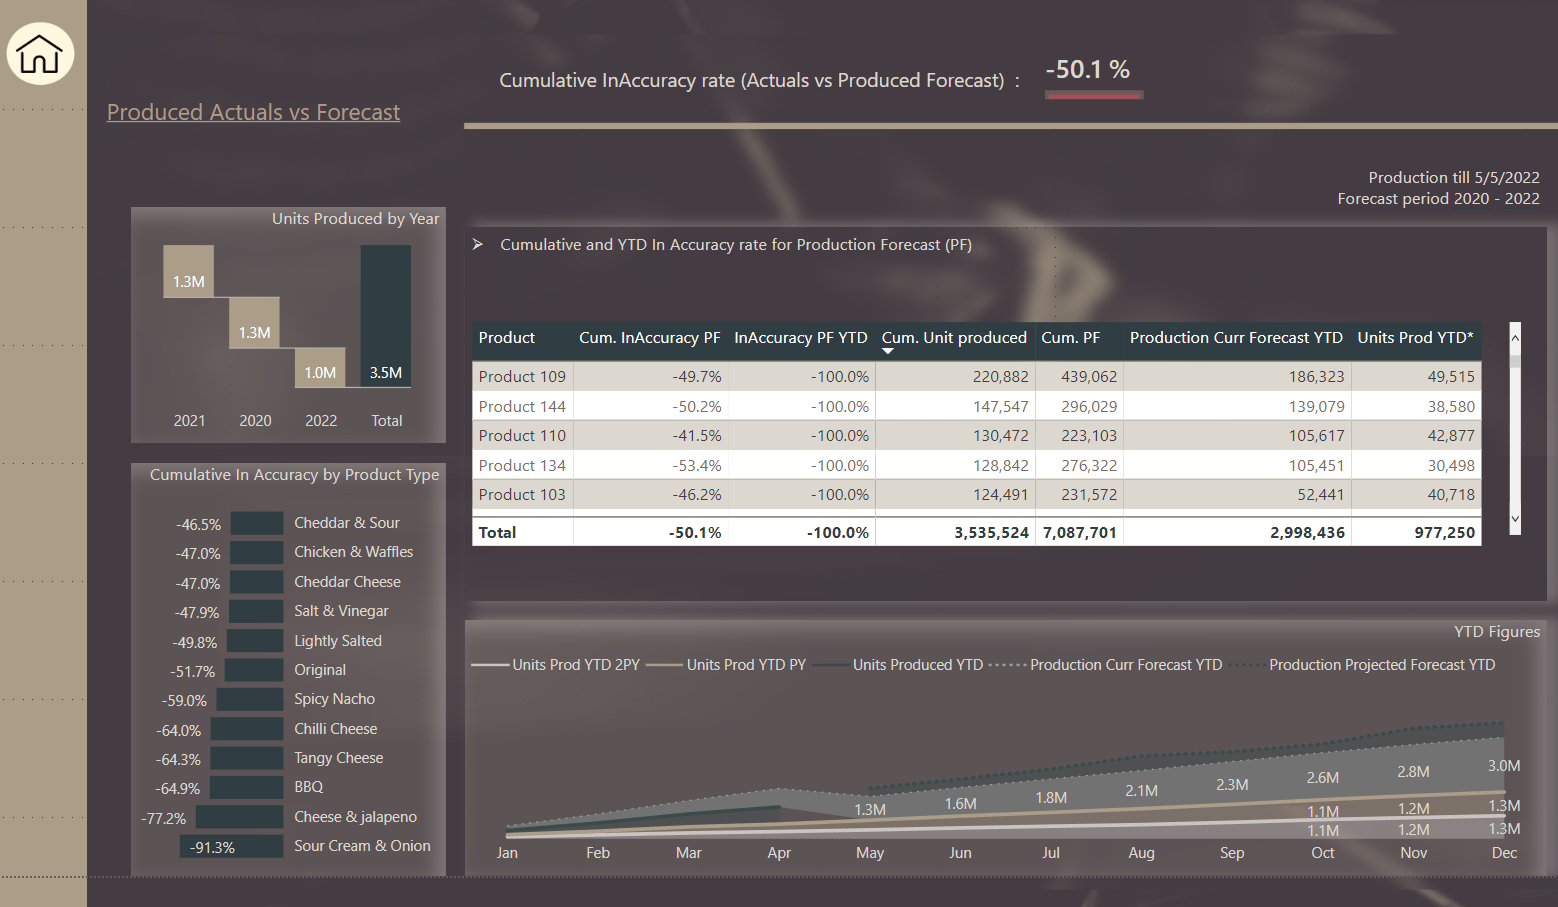
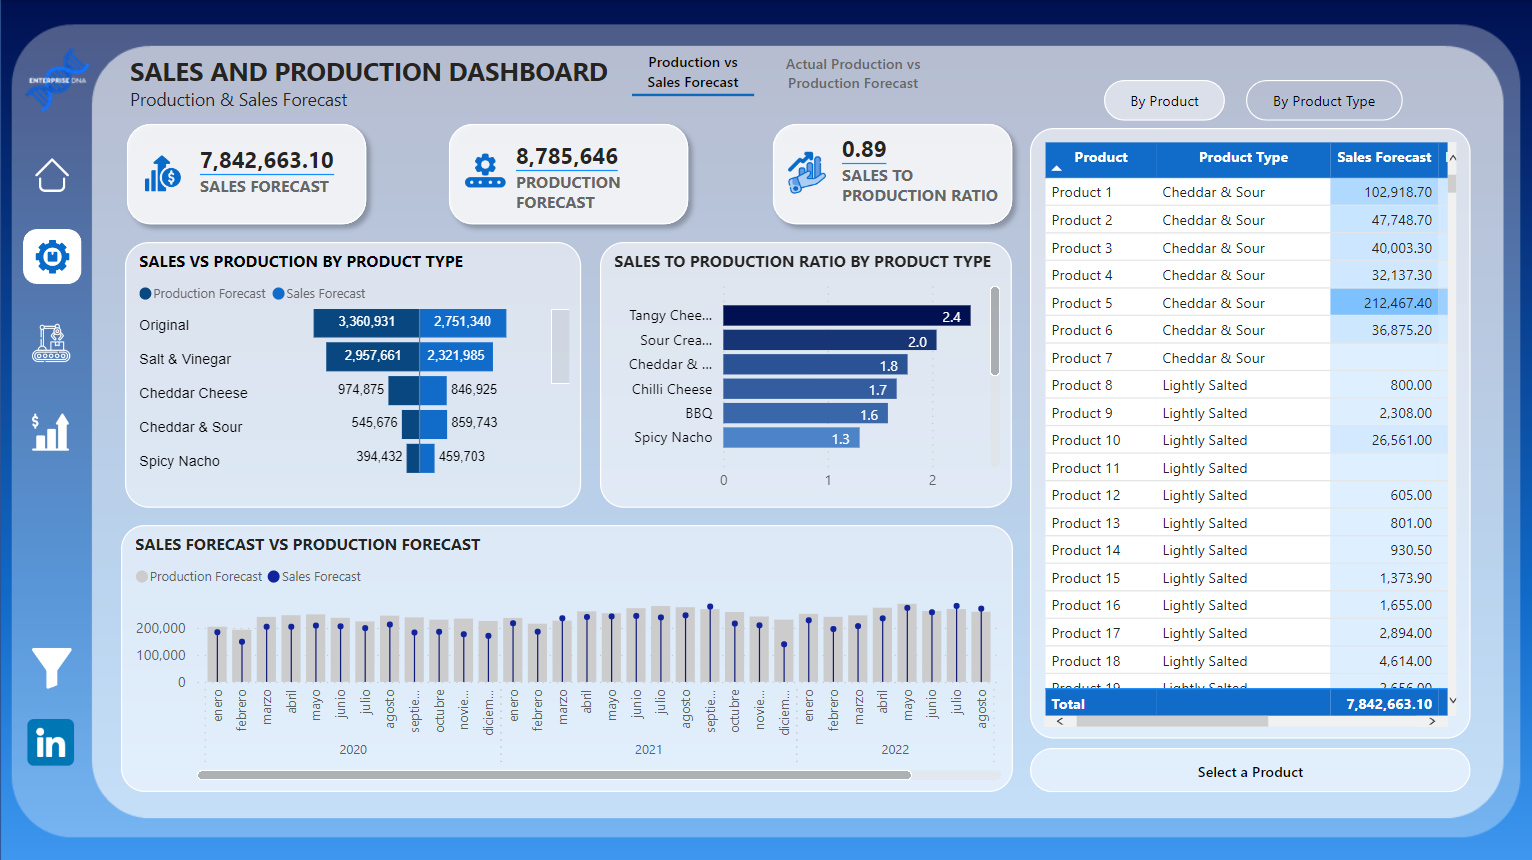
Forecasting Manufacturing and production is a method of predicting the quantity of products that will be produced in each timeframe to match the sales forecast.

It is important that production levels match up to the actual market demands for a business to be successful. Having truncated production will lead to a company not meeting customers demands which implies unhappy customers and ultimately loss of sales.

Accuracy of forecast based on data is at 40.97 percent and needs to be increased urgently by finding more efficient ways to forecast production.

RECOMMENDATIONS AND CONCLUSIONS

SALES TEAM

Sales team needs to understand that sales forecast is prognostic of the number of products that will be sold in the time ahead. These predictions should be made based on sales trend at different periods in time. For example, January of every year have seen increase in demands and sales team should be prepared for such increase.

Methodical forecasting needs to be Implemented. An inventory management software should be considered for forecasting. Foreseeing and contemplating an increase in orders is essential for a practicable turnaround time on products. Guessing game must be totally eliminated from selling and manufacturing prediction techniques.

Predictive Forecasting must be enforced with the use of AI and machine learning to scrutinize past data to efficiently predict future sales.

PRODUCTION TEAM

Forecasting production is giving an estimate of the demand a company is expecting to see in the future. Production forecasting also helps businesses in predicting the number of resources that will be needed in manufacturing the forecasted products demand.

Production team should make predictions based on steady trends in company data. If the level of production levels grows by 1 percent each month for the past three years, then we can predict same for the next month.

It is also critical that production team starts looking at Inventory before making production forecast. We do not want to surpass demand for a product neither do we want to run out of required resources needed for production. Production managers should keep abreast of stock and inventory while making predictions.

A base volume of inventory is obligatory to fulfil short-term demand disparity, but if there is a towering inventory on a particular product, the production of such product must be lowered until stock has reduced to the suitable level.

PITFALLS OR SHORTCOMINGS OF YOUR ANALYSIS.

Major pitfall of the analysis will be an incomprehensive and very little number of sales historical data.

You may view the full report here: Afolashade Allinson

Please feel free to give Afolashade Allinson your feedback on her report.

Thanks!

2 Likes

Hello everyone,
I have a doubt in the following question that we have to answer in the report:
• Identify products with high forecast inaccuracies based on historical data (2020 to date)

Are you referring to the difference between actual and forecast production rather than relying on the Forecast Accuracy measure?
• Forecast Accuracy = [(Actual Production/Forecast Production) *100]

For a product where 100 units have been produced and 200 were forecast, the forecast accuracy is 50% and for another product with 200 actual units and 100 forecast we get a 200% accuracy.
In case of using the difference, in both products we have been wrong in 100 units and we would have the same rate of inaccuracy.

Regards,

1 Like

@jafernandezpuga

Thanks for your question, I would personally go for the Forecast accuracy measure and see how this work accross my products line. Nonetheless you can also create a couple of other measures that compare differences and how these works together.

I hope this helps.

Federico

1 Like

@crisgarher

Hi Cris, your post and my referal to the data owner, remember it is a real work dataset, uncover some communication issues between the sales team and accounting department of the Company.

The error happens when sales people make the items inactive as they think they wouldnt get sales for those products. However, when they did get some sales for these product, they activated these items without informing the accounting department.

If these products are not activated by accounting department then the would not appear in Finished Goods Report.

The Company recomendation is to enter a comment/recomendation in the report with the following information “Items to be made Active” because this can act as a trigger for accounting department whenever they would run the reports.

I hope this helps.

Federico Pastor

1 Like

@crisgarher That’s a really nice catch!

Thanks for the feedback @FPastor, I will make sure to add the recommendations in my report.

Thanks @MudassirAli!

1 Like

Hi Folks!

My submission report is still work in progress, but I’ve just finished the page related with “Inventory with low or no sales” and I decided to share it with you.

Well, the page is finished just if the feedback received is not bad! :grin:

PD: @FPastor Finally I could find some time to work in it. Sleep is overrated!

Hope you like it!

9 Likes

@BernatDuran This is looking really really good :ok_hand:

Excited to see your complete entry soon.

Did you find any problems playing with this data? Asking for a friend :slight_smile:

3 Likes

@MudassirAli appreciate your feedback! Thanks :slight_smile:

hahah

Answering your question: YES. I think that I’ve never found a real dataset clean and neat, and this is not an exception.

As it’s mentioned above, there are ambiguity in some products due to an existing difference between the way it’s inventory is calculated.

Another thing that made me struggle a little bit is:

  • When it comes to find the “Shortage” (SalesOrder vs Inventory) , should we consider the products that are NOT going to be sold? In my honest opinion, we should not.

To my way of thinking, it is important to specify the way you are having the numbers. If the user that’s going to consume and use the report knows how it has been built and understand what you are going to show, it will be fine for everyone. That’s why I try to use info buttons and anotations or some comments in almost page!

What did you find complicated regarding the dataset?

2 Likes

@BernatDuran it look really great.

I am glad you find time so we can see it. Thank you.

Could not agree more about the sleep :sweat_smile:

2 Likes

Hi all,

Since, my time for this challenge has passed out, here is my report.

This time I choose to try PowerPoint backgrounds - and have lots of trouble to fit all in (since it is dynamically changing even if I choose fit option). I need more time to experiment with this part. Hope it will work after publishing.

I was using different techniques. After Reporting & Data Visualization Summit, I change approach.

First I start with Executive Overview about current/last month (May)

Below each section I put short summary / recommendation /sometimes include some explanation parts.

Since there are certain time gaps in data sets - I choose strictly navigated approach.

Each section has info and details part

and go only back to home (strictly data storytelling navigation approach)

Since there are New product shortage tooltip is specially designed to tell more what is need to produce it

lnventory has different tooltip approach


Here I play with In accuracy approach - since there are lots of demands regarding this.

Also simple projected production forecast was calculated.

And finally Sales vs Production Forecast

All details reports have clustered bar chart by product type which can be used as filter too.

In Inventory part I choose also to put No/Low part so it Product type with this can be easy highlight

Link to whole report:

Hope you like it.

Feel free to comment and give feedback.

Thank you.

Good luck everyone.

Best regards,
Maja

6 Likes

@BernatDuran - regarding Shortage - I analyze this part as what products are ordered but missing on Inventory.

Yes, there are lots of things to explain - that’s why I include so many info parts in report - if I have more time - it will be even more.

Good luck.

3 Likes

@BernatDuran

Excellent work Bernat. I can’t wait to see the final outcome.

Federico

1 Like

@mspanic

Hi Maja,

Welcome to Challenge 20, another great entry. Excellent work

There are some small issues when viewing your report in web as you mention. See of you can fix otherwise is does not look as it should be. It may be using the wallpaper rather than background options in the format pane??

Thanks.

Federico

1 Like

Hi Frederico / @FPastor ,

Many thanks for your valuable feedback. Manage to change this. Hope this will work now.

Best regards,
Maja

Hello, everyone,
I’m parsing the data to answer the question:
How many shortages of orders (compare Sales Orders vs Finished Goods Inventory?
In the Sales Orders table we have the Quantity column that tells us the amount we have of each product in inventory.
If we combine this table with the Finished Goods Inventory table through the product code, we see that this amount coincides with the Closing field of the latter for all records except 25 products, as previously discussed in the forum.
These 25 products are not in the finished goods inventory but we have the information we need on the number of Sales Orders.
I consider that it is not necessary to compare the Sales Orders table with the Finished Goods Inventory table since the quantity information in the Sales Orders table is correct.

To understand the information in the Finished Goods Inventory table, is the date 05/24/2022 the date on which the inventory was obtained?
This date is after the sales order information, which is for 05/05/2022, so does it make sense to combine these two tables?

Are the fields Opening, Produced, Consumed and Closing the quantities for the day 05/24/2022?
Are we going to have this information daily?
In the case of records in which it is not true that the closing amount does not coincide with the opening amount plus the amount produced minus the amount consumed, should we correct these inconsistencies by creating a calculated column or a calculated column indicating that there is an error in this calculation?

Regards

3 Likes

Great work @mspanic !

I like the way you decided to show the anotations below every topic in the main page, really useful. Same for the tooltip about the product, I think that’s a really good way to present more details.

The structure of the visuals you used to give an answer about the “Shorting” is really similar to mine! Now I’m sure that the approach about that topic is good!

PD: Try to revise the Info Button bookmark in “Produced vs Forecast”, at least in my case the window is opened in an incorrect position :slight_smile:

1 Like

After seeing different numbers in the submissions, I decided to revise the measures used in my model and while digging into the dataset I realized that I may have a mistake calculating the Quantity of products with NO sales.

For some reason my first approach was to compare the closing column in Finished Goods Inventory (>0) with the Consumed column (0) , as I show in the following measure:

The result in this case is 64.

LowSales - # Products 0 Sales - First Approach = 
VAR _InventorySales =
FILTER(
    ADDCOLUMNS(
        SUMMARIZE('Products'
            ,'Products'[Product])
        , "@Inventory", SUMX( RELATEDTABLE('Finished Goods Inventory'), 'Finished Goods Inventory'[Closing])+0
        , "@SalesOrder", SUMX( RELATEDTABLE('Finished Goods Inventory'), 'Finished Goods Inventory'[Consumed])*-1+0
        )
, [@Inventory] > 0 && [@SalesOrder] <= 0
 )
RETURN
COUNTX(_InventorySales, [Product])

After revising it, I decided to compare the products that has 0 qty in Sales Order vs the Products with a closing inventory over 0, as I detail in the following measure:

The result in this case is 52.

LowSales - # Products 0 Sales - Revised Approach = 
VAR _InventorySales =
FILTER(
    ADDCOLUMNS(
        SUMMARIZE('Products'
            ,'Products'[Product])
        , "@Inventory", SUMX( RELATEDTABLE('Finished Goods Inventory'), 'Finished Goods Inventory'[Closing])+0
        , "@SalesOrder", SUMX( RELATEDTABLE('Sales Orders'), 'Sales Orders'[Value])+0
        )
, [@Inventory] > 0 && [@SalesOrder] <= 0
 )
RETURN
COUNTX(_InventorySales, [Product])

How did you calculate the Products with NO Sales?

3 Likes

@jafernandezpuga

Hi,

It appears that I missed this one, please copying the data owner for clarification.

@MudassirAli

Can you please help with Jose’s question.

Thanks and regards,

Federico

1 Like

Hi everyone, this is an entry submitted by Camilo Corrales sent to us via email.

Here’s how Camilo described it:

Hi everybody. I accepted the Enterprise DNA challenge.

This is my first ever entry to an EDNA Challenge and i feel it was really challenging, i tried to create a report that solves every single question that the end user can have about the dataset (At least all the questions that i thought about) so I used multiple techniques to make the report more interactive, like multiple bookmarks and DrillThroughs.

I really enjoy being exposed and accepting different challenges because it allows me to get my hands on multiple datasets from different industries that need different approaches. For this specific challenge i made a lot of research about inventory management kpis and metrics.

I invite you to navigate the report and provide feedback it will be very welcomed by me. Thanks again to the Team for the opportunity and providing this dataset!

It was very rewarding experience. Thank you for the opportunity to participate! Best of luck to all the participants!

You may view the full report here:
Camilo Corrales

Please feel free to give Camilo your feedback on his report.

6 Likes