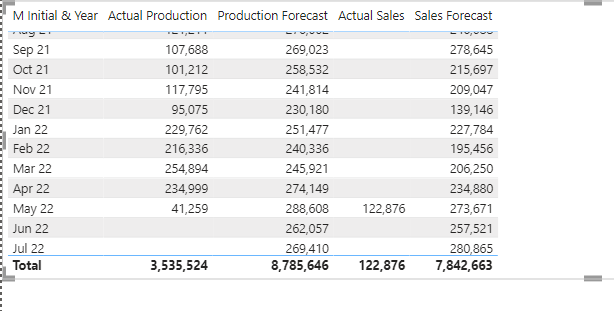
@FPastor agree with @KimC on comparing sales forecast to actual sales orders rather than production forecast. It seems to me the sales orders is incomplete as we only have sales for May 22 unless I am missing something as can’t quite understand the purpose of the qty column in sales orders. A bit of clarification will be helpful. Thanks.

Hi @ambepat
As I assumed (maybe not correctly) - in Sales tables - we have 2 types of quantity
- column Quantity (which is Finish good Inventory - Closing quantity)
- column Quantity Order (which you get when you unpivot Dates)
I suppose that they have some report comparing and monitoring this 2 measures which we use as a data source for PBI
When I use this unpivot techniques - for Quantity Order I got more then 1 Dates (10 dates)
If you look Excel
you will see that there is a more then 1 Dates.
In Inventory table we have column Units Consumed - which is used to analyze :
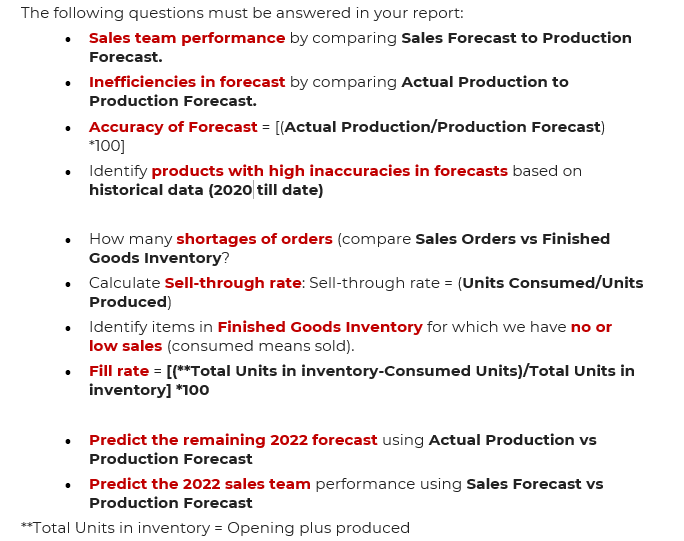
Identify items in Finished Goods Inventory for which we have no or low sales (consumed means sold).
So I assume that Units - Consumed - = Sold
(but in Inventory table is snapshot for May, 24 2022)
Regarding comparing
- sales forecast to actual sales
- sales forecast to production sales
it’s 2 different type of analysis. First see how sales parts only and second to see how you combine sales and production part in the whole ( is it just in time, lean or there are time mismatching points). Since this is also demands in several points ( Sales team performance, Predict the 2022 sales team performance) - this is also part what need to analyze and improve.
Don’t forget we have also Actual Production/Production Forecast ( to calculateAccuracy of Forecast).
Hope it helps.
Absolutely agree! Thanks @mspanic (and others), you have saved me a couple of hours (minimum!).
Let’s see if I have enough time to submit something decent for this Challenge! Really busy weeks are coming, but I’ll try my best ![]()
Good luck everyone!
@BernatDuran - glad it can help.
Hope you manage to find time so we can see your magic in action.
From the data provider. I hope this helps.
"Sell through rate can be calculated from Finished Goods data as it has both Units Consumed and Units Produced for the current month"
Please let me know if this is OK with you or I need to seek further clarifications.
Federico
Thank you @FPastor & @mspanic, That is very helpful, it has been a long time since I worked with Finished Goods! Just to clarify further, did you assume then, that the Finished Goods opening balance is 1 Jan 2022?
MEMO
TO: POWER BI REPORT DEVELOPERS – CHALLENGE 20
FROM: AIKEEN G – CEO OF AIKEEN INDUSTRIES
DATE: 05 June 2022
SUBJECT: CLARIFICATION NOTES
Sales Orders:
These are the current and future sales (14 days) and is compared with Closing inventory to see how much we are shorting and must adjust our production schedule accordingly this means disruption in the production process. For example, Product 5 has closing inventory 2,284 but the sales orders are for 5,364 units that means we do not have enough inventory to sell.
Why are we having this shortage problem? Inefficiencies in our forecasting system.
Finished Goods & Sales Orders report is run daily, and this is what management looks at for quick overview of sales and inventory position.
Sell through rate can be calculated from Finished Goods data as it has both Units Consumed and Units Produced for the current month.
Sales performance can be measure in diverse ways:
-
Comparing Sales Forecast (budget which does not change during the period) against Production Forecast (changed monthly based on demand factors or getting new contracts or business).
-
Comparing Sales Forecast with Actual Production.
-
Comparing Production Forecast with Actual Production.
People must be confused why we have data for actual production for each day but not actual sales for each day.
If actual production data is till 5th May that’s why sales orders are from 6th may onwards as these are the sales orders of future.
If I run the sales orders report now, it would give me the sales orders starting from 5th June till 19th June. This is to prepare in advance and adjust production schedule accordingly to meet the sales in the short-term future.
To put it simply, we can compare sales orders to our closing inventory. If sales order for next 14 days for a particular product is greater than our closing inventory, then we must adjust in production to produce that product so we can meet the sales or else we will short the customer and the customer will be unhappy.
Aikeen G
CEO Aikeen Industries
Thanks for the update @FPastor , extremely useful!
Hello @FPastor,
For May 6, 2022 we do not have real production information or future Sales Orders.
Regards
Thanks, we work with the data we have and try to analyse the information contained in the dataset. Real data will be never perfect to the contrary is rather imperfect most of the time.
I hope this clarifies.
Federico
Hi from a new member,
Federico, my question is regarding the calculation of the Sell-through rate: Sell-through rate = Units Consumed / Units Produced.
Should the Units Opening be combined with the Units Produced so there is no division by zero?
Thanks,
Vera
Hi Vera / @Verambros ,
Welcome.
I used DIVIDE function Sell through rate = DIVIDE ([Units Consumed],[Units produced],0) - do it will be 0 if Units produced is zero.
I assume this is sell through - shows what are the units that are produced and sold after that.
Looking forward to see your work.
Good luck,
Maja
Thanks for your question, I think Maja, @mspanic, provided you with the answer. When possible use the DIVIDE function in Power BI.
I hope this helps,
Federico
PS. @mspanic Thank you Maja 
Hi Maja,
Thanks for the clarification! That’s exactly what I was looking for.
Have a wonderful weekend and thanks for the support!
Vera
Hi Federico,
Thanks for your response! That’s exactly what I was looking for.
Vera
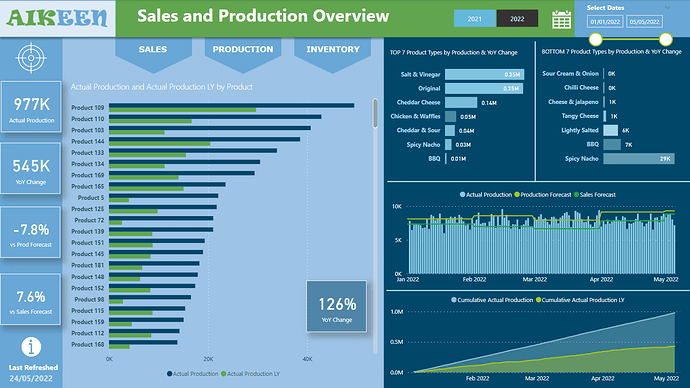
Hi everyone, this is an entry submitted by Monika Spylczyn sent to us via email.
Here’s how Monika described it:
It was very rewarding experience. Thank you for the opportunity to participate! Best of luck to all the participants!
You may view the full report here:
Monika Spylczyn
Please feel free to give Monika your feedback on her report.
Hello everyone,
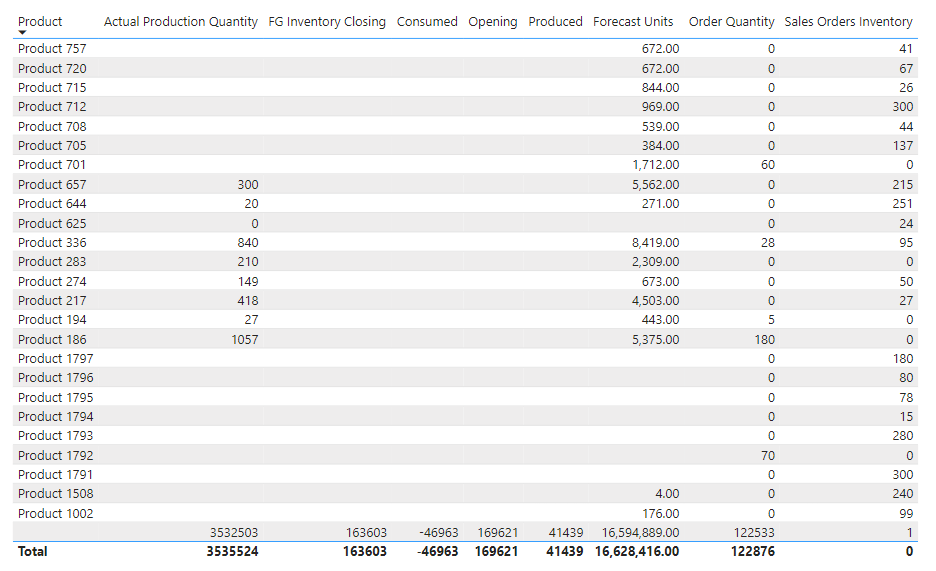
I have found 25 Products which have Inventory in the Sales Orders Table, but are not present in the Finished Good Inventory Table, also:
- Only 9/25 Products have data in the Actual Production Table.
- Only 17/25 Products have data in the Production & Sales Forecast Table.
- Only 4/25 Products have order quantities in the Sales Orders Table.
- Would it be safe to assume the Sales Inventory Quantities are wrong?
- Would it be safe to “erase” this products from our data?
Thanks,
Cristian J. Garcia
Hi Cris,
Firstly we do not make assumptions of data provided by company or clients, we always clarify to ensure our analysis is correct and any data discrepancies are clarified.
This is a real company dataset thus I have put your question to the dataset owner for further clarification but I do believe that there are some comments here in the chats, above, that will help you clarify initially some of your questions.
I or one of my colleagues will reply fully to you asap.
Thanks.
Federico Pastor


