Dear Concern,
I’d like the support on the mention below pointers
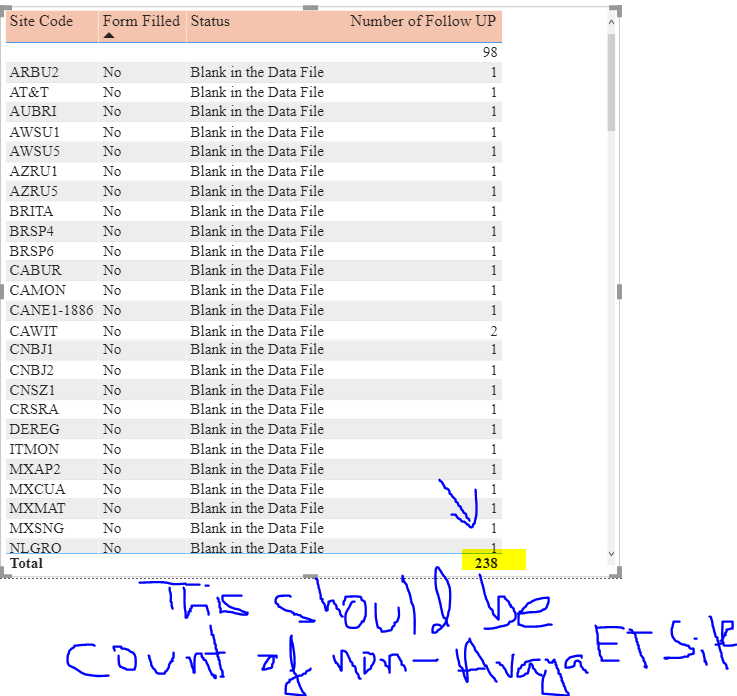
I have three Regions but when I filter out the Avaya ET Site from the Query Editor on the "Phone System in use PBX: , the Slicer shows the Blank
I want to create a measure (Total no of Sites) filtering out the “Avaya ET Sites” to count everything except for " Avaya ET" from the Phone System in use(PBX).
I want to show the Number of follow up made for each site code but that is in the different table and the and the count of the sites is also changes
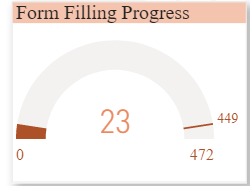
I also want to show the Percentages in the Gauge Visual
Can someone also give me some tutorials on the creating my own custom visuals (I am not a programmer but I am Hard Working and have willingness to learn.
I have attached the .PBIX file, Source File (Excel) and two images
Hi @mohammedkhan11, we aim to consistently improve the topics being posted on the forum to help you in getting a strong solution faster. While waiting for a response, here are some tips so you can get the most out of the forum and other Enterprise DNA resources.
Use the forum search to discover if your query has been asked before by another member.
When posting a topic with formula make sure that it is correctly formatted to preformatted text </>.
Use the proper category that best describes your topic
Provide as much context to a question as possible.
Include demo pbix file, images of the entire scenario you are dealing with, screenshot of the data model, details of how you want to visualize a result, and any other supporting links and details.
So as per the queries asked I’ll be providing the solution pointers wise as follows -
I’m providing a link of video which explains about how to eliminate the blanks from the data. The video explains extensively about why this type of situation arises and how you can deal with it.
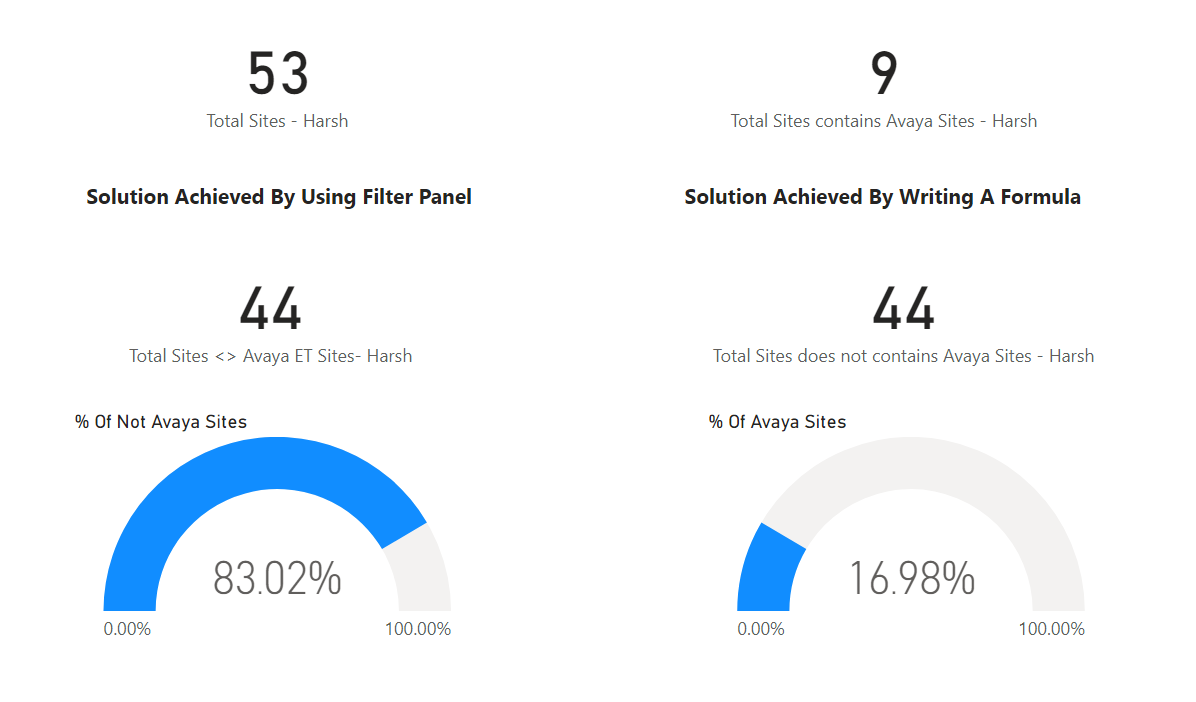
Under this point, I’ll be clubbing the solution for queries asked under the point no. 2 and 4. Firstly, I’ll be providing for point no. 2. So in order to achieve the count of total no. of sites not equal to Avaya. You can simply do this by using the Filter Panel where by selecting the option of “Dos Not Contains = Avaya” or by writing the formula as provided below -
Total Sites - Harsh = DISTINCTCOUNT( 'PBI Data_'[Phone System In Use (PBX)] )
Total Sites Contains Avaya Sites - Harsh =
CALCULATE( [Total Sites - Harsh] ,
    CONTAINSSTRING( 'PBI Data_'[Phone System In Use (PBX)] , "Avaya" ) )

`Total Sites does not contains Avaya Sites - Harsh =
     [Total Sites - Harsh] - [Total Sites contains Avaya Sites - Harsh]`

`% Of Avaya Sites =
DIVIDE( [Total Sites contains Avaya Sites - Harsh] , [Total Sites - Harsh] , 0 )`

% Of Not Avaya Sites =
DIVIDE( [Total Sites does not contains Avaya Sites - Harsh] , [Total Sites - Harsh] , 0 )
So now, you can also show the Percentage in the Gauge Visual. Below are the screenshots provided for the reference which provides the solution for the point no. 2 and 4.
I’m also providing below a link of a video about how to create a percentage gauge visual.
For point no. 3 I didn’t understood the exact requirement please specify the exact requirements alongwith the mock up of the expected results so that members of our forum have a clearer picture of the output that you’re trying to achieve.
And for the last point, since you’re trying to develop your own customized visuals I’m providing a link from where you can learn how to create own customized visuals.
Lastly, I’m also providing a working of the Excel as well as PBIX file for the reference.
Note: In your original Excel File, it does not contains the data with the worksheet names “PBI FollowUP” and “SiteInfo”. I’ve included the data into the Excel file by copying it from Power BI. Please provide the accurate data so that which are in sync with the working of your PBIX file.
Hi @mohammedkhan11, a response on this post has been tagged as “Solution”. If you have a follow question or concern related to this topic, please remove the Solution tag first by clicking the three dots beside Reply and then untick the check box. Also, we’ve recently launched the Enterprise DNA Forum User Experience Survey, please feel free to answer it and give your insights on how we can further improve the Support forum. Thanks!