I have been trying multiple techniques used in the Budgeting Allocation videos and searching topics across the forum for many days but I can’t find a way to solve my problem. Maybe the solution is easier than what I tried to replicate. Rolling backlog Forecast test.pbix (1.6 MB)
What I want is to calculate the forecasted revenue based on the remaining contract backlog over a period of time dynamically.
I want to distribute (proportionnaly over the ending date of the project) the remaining backlog preferably by months over next 12 months for example or next 24 months.
Remark: the remaining backlog amount is not fixed, every month it diminishes, so I need to recalculate month over month.
I have created a fake sample with only 2 projects in the pbix file.
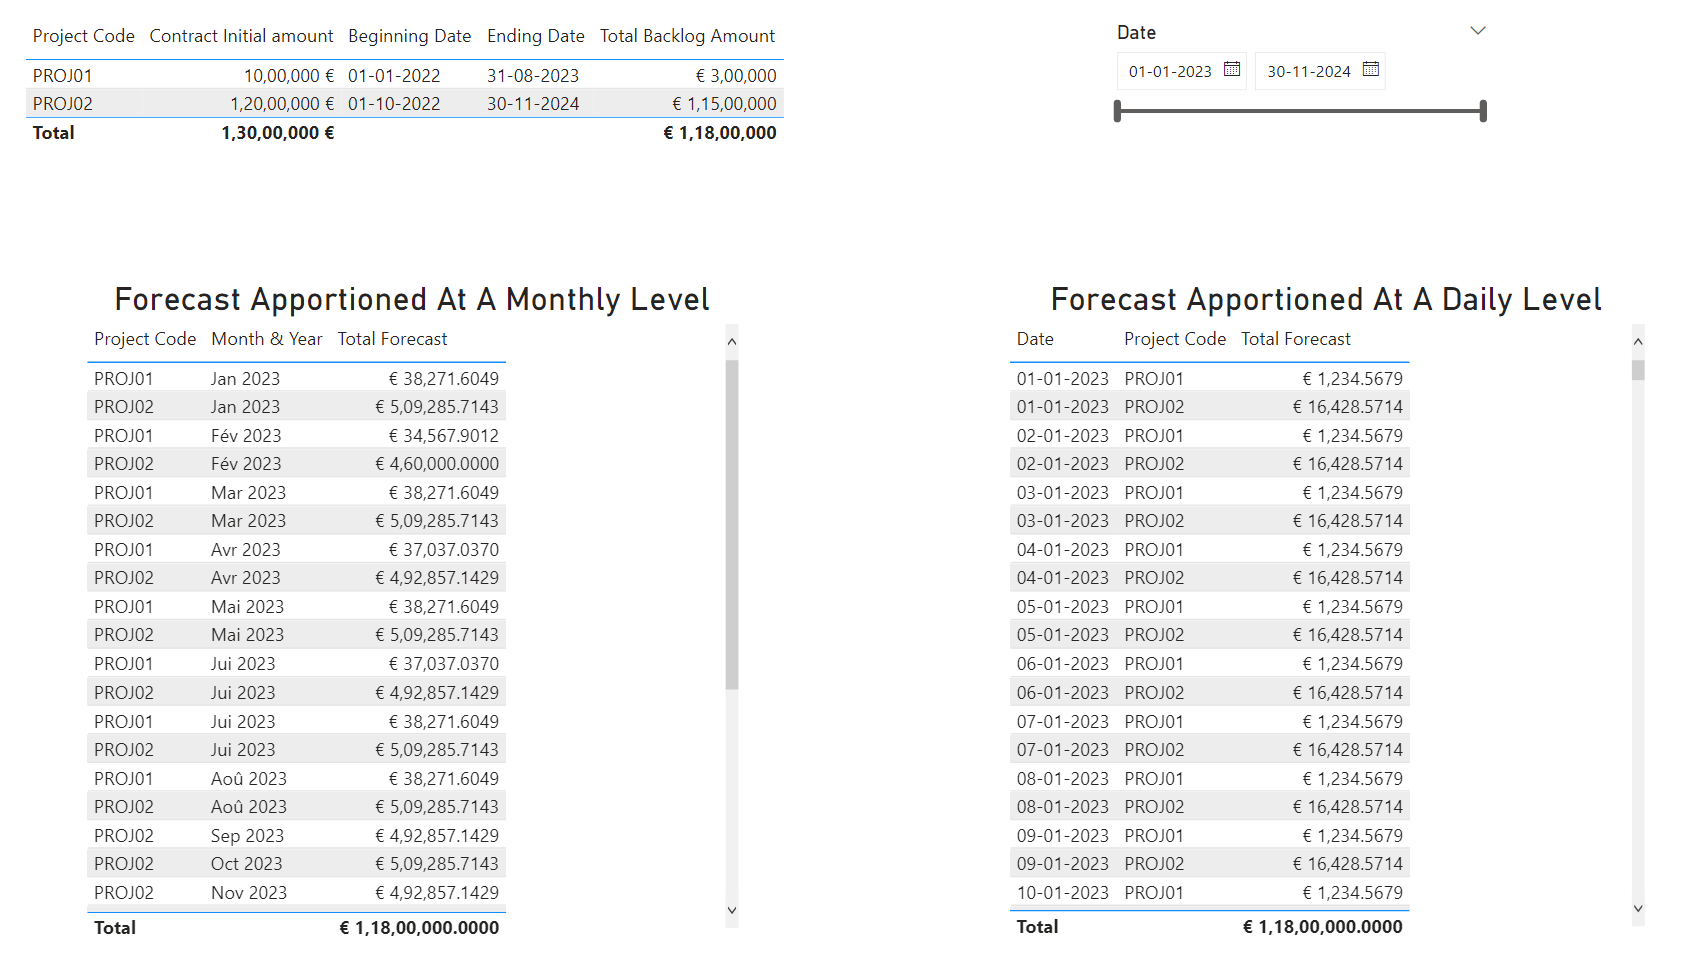
In order to apportion the backlog amount over the ending date of the project. Below is the DAX measure alongwith the screenshot of the final results provided for the reference -
Total Forecast =

-- Apportionment of Backlog Amount From 01/01/2023 Till Ending Dates of the respective Projects


VAR _Backlog_As_On =
DATE( YEAR( TODAY() ) , MONTH( TODAY() ) , 01 )

VAR _vTable_Forecasts =
ADDCOLUMNS(
    SUMMARIZE(
        Projects ,
        Projects[Project Code] ,
        Projects[Ending Date] ) ,
    "@Total_Forecast" ,
    DIVIDE(
        CALCULATE( SUM( Projects[Backlog Amount as of 01/01/2023] ) ) ,
        DATEDIFF( _Backlog_As_On , Projects[Ending Date] , DAY ) + 1 ) )

VAR _Filtered_Table =
FILTER(
    CROSSJOIN(
        VALUES( Dates[Date] ) ,
        _vTable_Forecasts ) ,
    Dates[Date] >= _Backlog_As_On &&
    Dates[Date] <= CALCULATE( MAX( Projects[Ending Date] ) ) )

VAR _Results =
SUMX(
    _Filtered_Table ,
    [@Total_Forecast] )

RETURN
_Results
This technique is a consolidation of various concepts coming together so I’m not sure it’s covered in any of our previous videos as of now. Just few days back I covered and explained this technique to other forum member. Below is the link of that post provided for the reference.