Hello @Timmay,
Thank You for posting your query onto the Forum.
Firstly, let’s understand why you’re getting the wrong results in your large measure and then we’ll see how we can convert those 3 measures into one consolidated measure to achieve the same results.
So in your large measure, the first mistake which you had made is referencing a naked variable inside a “CALCULATE()” function. You cannot use/reference/call a naked variable directly inside CALCULATE since variables are considered as “constants”. That is, they evaluate the results and those results are stored or freezed and therefore, when called directly inside CALCULATE, it’ll just evaluate it over the already freezed results. Below is the link provided from RADACAD website which will explain it in-detail about how and when to make right usage of variables.
Note: Before proceeding further with the later part of the explanation, please go through the link so that next part of explanation will be more understandable.
Now, once you’ve gone through the above provided link. Here’s how your measure was evaluating the results at the back-end.
Create a physical DAX generated table by pasting the below provided formula. -
Incorrect Budgets Table =
VAR _vTable_Budgets =
ADDCOLUMNS(
    SUMMARIZE(
        'Budget' ,
        'Budget'[Budget Date] ,
        'Budget'[Month End Date] ) ,
    "@DailySales",
    DIVIDE(
        [Budget Sales],
        DATEDIFF( 'Budget'[Budget Date] , 'Budget'[Month End Date] , DAY ) + 1 ) )

VAR _Cross_Join =
CROSSJOIN(
    VALUES( Dates[Date] ) ,
    _vTable_Budgets )

RETURN
_Cross_Join
You’ll see that, it’ll generate all possible combination of rows between “Dates[Date]” and “Budgets[Budget Date] & Budgets[Month End Date]” columns. See this -
![Combination of Rows Between Dates[Date] column and Budgets[Budget Date] & Budgets[Month End Date] columns](https://forum.enterprisedna.co/uploads/db7134/original/3X/5/b/5bcca816bf30486f8b595254a959387bb9c4a22a.png)
And when you convert the above provided formula into a measure, it’ll yield the same wrong results which you were getting originally. Here’s the converted DAX measure based on above provided formula -
Incorrect Budgets =
VAR _vTable_Budgets =
ADDCOLUMNS(
    SUMMARIZE(
        'Budget' ,
        'Budget'[Budget Date] ,
        'Budget'[Month End Date] ) ,
    "@DailySales",
    DIVIDE(
        [Budget Sales],
        DATEDIFF( 'Budget'[Budget Date] , 'Budget'[Month End Date] , DAY ) + 1 ) )

VAR _Cross_Join =
SUMX(
    CROSSJOIN(
        VALUES( Dates[Date] ) ,
        _vTable_Budgets ) ,
    [@DailySales] )

RETURN
_Cross_Join
It means that, when you used/referenced/called a naked variable directly inside CALCULATE, it didn’t do anything in terms of evalaution with regards to that aspect. But on top of that, the other functions which you used inside that large measure just expanded the rows to all possible combination of dates. And to add to that misery, “SUMX()” function summed-up the results of those possible combination of rows for that particular financial year.
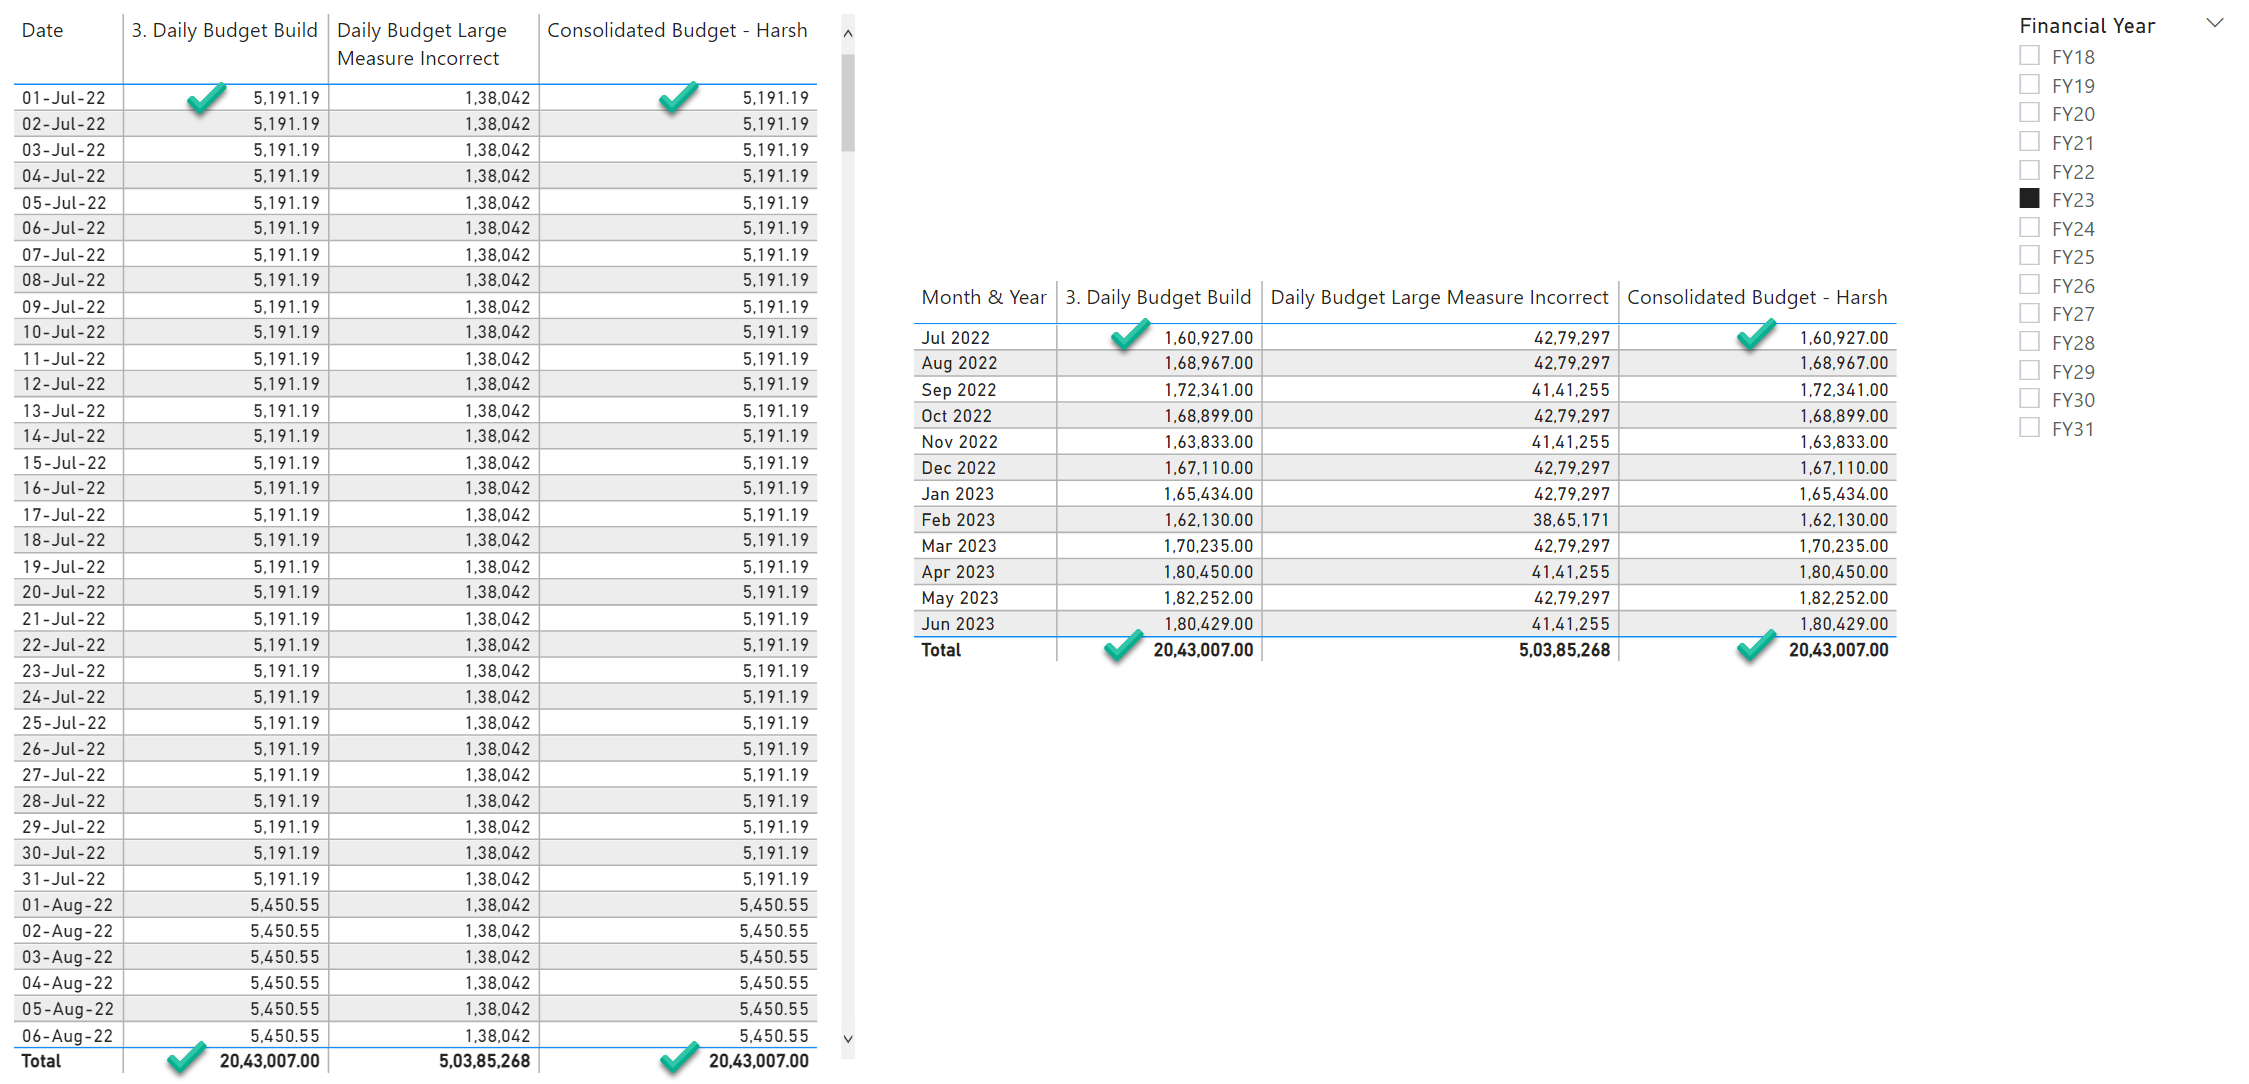
So now, while fixing the measure we need to ensure that only row of date for each day is generated inside a date range of budget for that particular month. For example, if budget month is from “1st July, 2022 - 31st July, 2022”, it needs to generate only 31 rows of dates for that given date range. And then against those generated set of dates, budget figure for each day needs to be evaluated accordingly. Below is the consolidated DAX measure alongwith the screenshot of the final results provided for the reference -
Consolidated Budget - Harsh =
VAR _vTable_Budgets =
ADDCOLUMNS(
    SUMMARIZE(
        'Budget' ,
        'Budget'[Budget Date] ,
        'Budget'[Month End Date] ) ,
    "@DailySales" ,
    DIVIDE(
        [Budget Sales] ,
        DATEDIFF( 'Budget'[Budget Date] , 'Budget'[Month End Date] , DAY ) + 1 ) )

VAR _Filtered_Table =
FILTER(
    CROSSJOIN(
        VALUES( Dates[Date] ) ,
        _vTable_Budgets ) ,
    Dates[Date] >= CALCULATE( MIN( Budget[Budget Date] ) ) &&
    Dates[Date] <= CALCULATE( MAX( Budget[Month End Date] ) ) )

VAR _Results =
SUMX(
    _Filtered_Table ,
    [@DailySales] )

RETURN
_Results
I’m also attaching the working of the PBIX file as well as an Excel file which contains the numbers evaluated based on wrong measure at the back-end of the engine for cross-verification for your reference purpose.
Hoping you find this useful and meets your requirements that you’ve been looking for.
Thanks and Warm Regards,
Harsh
Mock Data PBI - Budgets - Harsh.pbix (1.5 MB)
Budgets Cross-Verification Based On Incorrect Measure - Harsh.xlsx (2.2 MB)