Luukv93
January 12, 2019, 11:09am
1
Hi,
I have to calculate the average of averages.
I used the following measures:
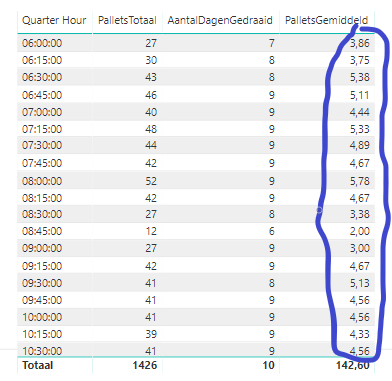
PalletsTotaal =
PalletsGemiddeld =
AantalDagenGedraaid =
So basically the measure that computes the average of PalletsGemiddeld must be one value
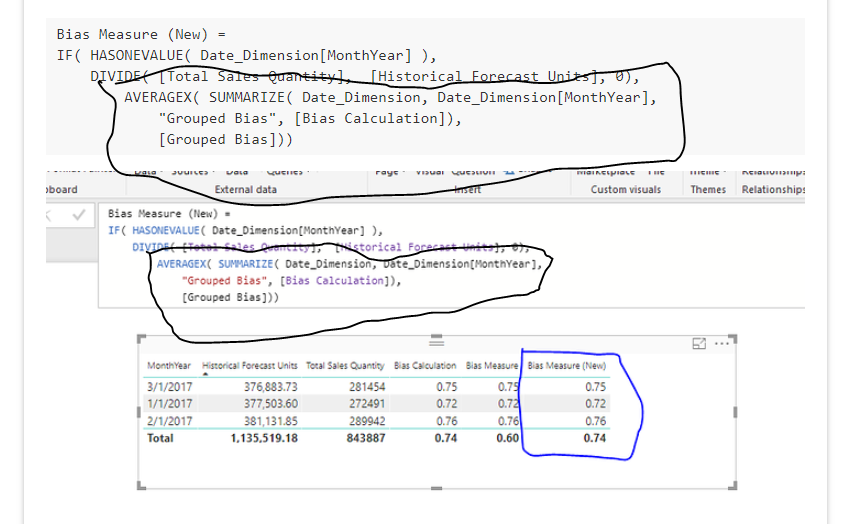
If you want the average of a number you’ve already calculated, try using SUMMARIZE to iterate through a virtual table based on those calculations.
For example,
AVERAGEX(
This is the technique I would try first.
For more details see this example below
I could see very quickly why there is an issue.
This filter in the table is doing nothing
[image]
Because it sits here within your model. With how your relationships are setup there is no way for any filter to reach across to the calculations that are in the table
[image]
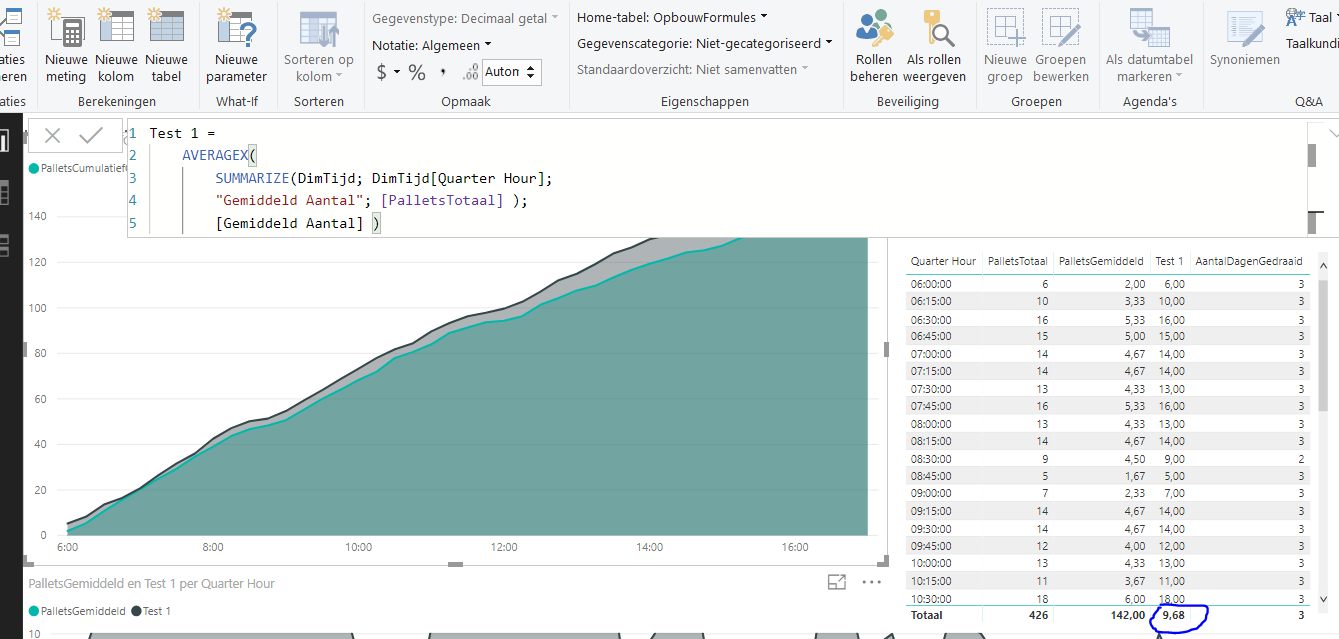
You’ll see I take that out of the table and nothing changes from the results
[image]
Because of the model, the formula is really worthless and needs to be improved.
Certainly review this course if you can. Filter need…
Here’s the main part to look at
See if this helps
Hi, thanks for quick response.
It’s exactly what I was looking for. Now I want the total value to be displayed on each quarter hour. So 9,68 in every quarter hour, making it a straight line.
Any thoughts on how to reach this?
I think you are on the right track. You used a measure similar to the one Sam suggested prior. Did this measure not give you the result you wanted? What is result looking for if not.
Thanks
Hi Jarrett,
I want 9,68 ( the average of all quarter hours) to be in each row, so I can display this as a straight line.
Best,
JAGP
January 24, 2019, 6:05pm
8
Hi @Luukv93 ,
I would try to use the next calculation if you want the straight line:
CALCULATE([Test 1],
          FILTER(ALL('DateTable'),
                 Quarterhourcolumn>=Min(Quarterhourcolumn)))