Grand Average total in table

Hi, I am an existing Powerpivot user trying to get familiar with Power BI and am trying to convert my Powerpivot models over to BI. I have encountered an issue with a formula though - it is designed to give me forecast bias for sales. The first part works correctly:

Bias Calculation = divide('Key Measures'[Total Sales Quantity],('Key Measures'[Historical Forecast Units]))

This gives me in a table for each forecast month my sales bias. However, I have in my pivot model a formula that gives me a grand average at the bottom of my table and this does not seem to work in BI - I need the average of the bias calculation iterated over the months. My formula in powerpivot was:

Bias Measure = AVERAGEX(DISTINCT('S&OP_History'[Month]),'Key Measures'[Bias Calculation])

Can anyone advise how I can get the table to give me an average of the measure as the grand total?

Thanks!

Not sure what that is all about around the holding of the post. I’ll have to look into it. I’ll come back regarding your question

If you have some images also that would be helpful of how this looks currently in the table. Also the model, especially the tables that calculations are over.

One thing is that you definitely should avoid placing the measure table name before measures. No need to do this.

Once I see this in a table.

Below I’ve looked to give you what I believe is likely the technique you need to use.

This one mocks up the initial calculation

Then this formula takes into account the average you want

You’ll see the totals are different but the number within the table are the same.

I guessing something like this will get you what you need.

Sam

Thanks - the example you gave absolutely does what I am looking to achieve but I cant get it to work in my table. I will try to demonstrate. I have two fact tables, one with sales info called ‘Combined Detail’ and one with historical forecast information called ‘S&OP History’. These are separate sources and combining them I feel would be problematic - perhaps this is where I cannot get the above to work.

Here is the first part of the bias calc which works and my layout:

As you can see the individual S&OP months work out the bias as I want but the total sums up the total forecast and total sales to give an aggregated bias - this is what I would like to be the average so in this case it should be 0.76. My layout is below:

Please let me know if any additional info is required.

Also, here is my attempt so far - as you can see the individual monthly bias is correct but I do not understand what the total is doing:

Would it be possible to summarize this down to say 2-3 months. Just so it’s easier to audit the numbers.

Any reason your dates are so out of order?

The reason it’s not reflecting the same is because the HASONEVALUE is doing nothing in your table, because the context is not (Month & Year) it’s being create by numerous date columns.

Within the has HASONEVALUE(…) place the S&OP Month column instead and see how that changes up the results.

Thanks Sam - I have tried what you recommended and still no nearer. The S&OP month in the wrong order - I haven’t looked into this yet, quite possibly because it doesn’t see these as dates, they are text, for this part I figured it wouldn’t matter. Below is a shorter version of my new table, you will see my total for ‘Bias Measure’ is 0.6 when it should be 0.74 as an average:

I’ve looked at this for a while.

I can’t tell from what I’m seeing what the issue is.

I would have to see the file and the model.

Thanks

Thanks Sam - I really cant fathom it, I thought moving my DAX formulas over from Powerpivot and converting them would be the easy part!! How best can I show you the PBIX file?

Can you post a link to download it, or send to sam.mckay@enterprisedna.co

I could see very quickly why there is an issue.

This filter in the table is doing nothing

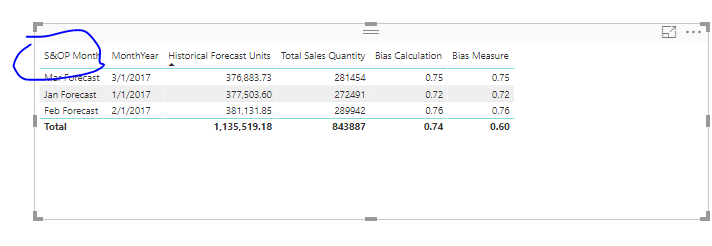
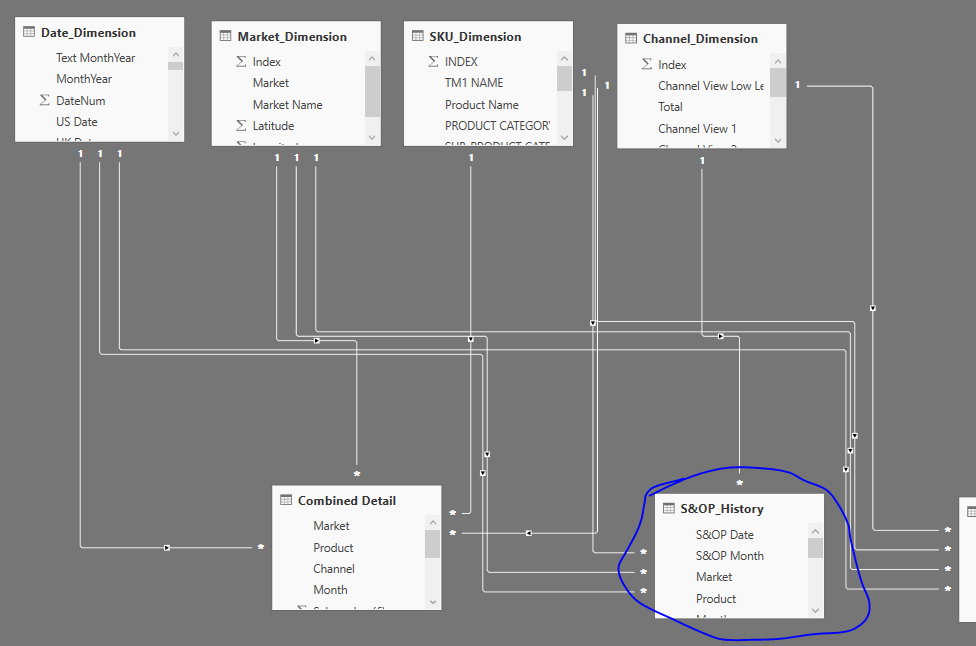
Because it sits here within your model. With how your relationships are setup there is no way for any filter to reach across to the calculations that are in the table

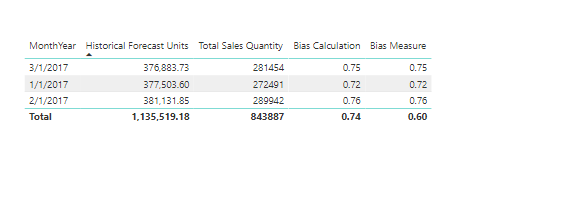
You’ll see I take that out of the table and nothing changes from the results

image

Because of the model, the formula is really worthless and needs to be improved.

Certainly review this course if you can. Filter needs to flow from the top layer down (think waterfall).

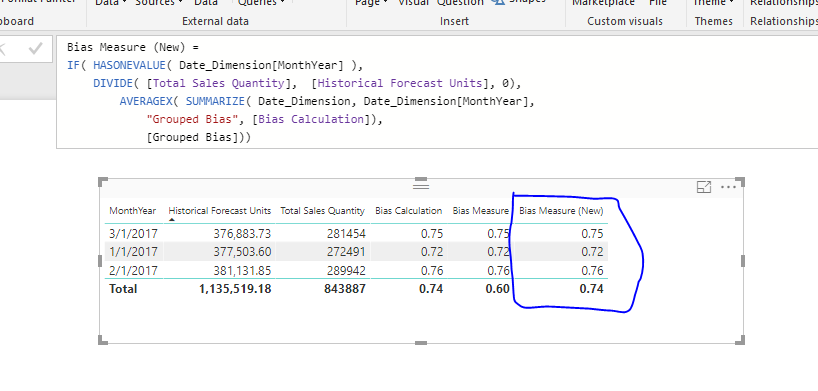
This is the formula you need. Well this gets a answer, may or might not be right, depends how you want to show this.

Bias Measure (New) = 
IF( HASONEVALUE( Date_Dimension[MonthYear] ),
    DIVIDE( [Total Sales Quantity],  [Historical Forecast Units], 0),
        AVERAGEX( SUMMARIZE( Date_Dimension, Date_Dimension[MonthYear],
            "Grouped Bias", [Bias Calculation]),
            [Grouped Bias]))

Also couple of other tips having seen the model. Really look to format formula if you can. Helps immensely in understanding how formulas work.

Mainly the model. Getting the model setup with simplify things immensely here.

Chrs
Sam

1 Like

Thank you, I have tried this out today and it seems to work - I am now working through tidying the model as you rightly point out.

That’s great, chrs