Hi all,
I am trying to come up with an efficient way of showing averages for different metrics in a single matrix column. I do not know if this needs to be done with Dax calculations for each metric or maybe create a table? The calculation needs to take into account all the date periods on the table and average out all the totals only for the months that has values greater than zero.
Below is a print screen of what the result should look like:
And this is what I created in BI. I was able to create a Matrix to mimic what is in the system but not the average column.
All the columns are calculated with Dax with the exception of the distance which is a sum from the data column.
Thanks again for all the help! 
Data Sample.csv (4.9 KB)
Report Sample.pbix (3.0 MB)
@Tali_USA
Nice question! Think there are a lot of use cases in which this could be needed.
See the attached file for two examples for Revenue and Distance.
Report Sample Solution DM.pbix (3.0 MB)
I think this provides enough information to make the measures for the remainder of your variables by just replacing the specific column in the to-be-made measure.
Let me know if anything is unclear. I am happy to help any further
Kind regards,
Pim Meesters
1 Like
Thanks Pim! This is awesome.
I tried to adjust the formula a bit by adding a filter to calculate only prior months but didn’t get the correct result. I need to show averages only for closed months and not include current and future months in the calculation. How could I go about adding this in you formula? Thank you so much for your help.
Distance Avg =
VAR ResultSum =
CALCULATE( SUM(‘Unit Cash Flow’[Total Miles]) )
VAR resultAvg =
AVERAGEX(
FILTER(
ADDCOLUMNS(
VALUES(‘Unit Cash Flow’[Deliver Period]),
“Sum”, CALCULATE( SUM(‘Unit Cash Flow’[Total Miles]))
),
[Sum] > 0
),
[Sum]
)
Return
IF( ISFILTERED(‘Unit Cash Flow’[Deliver Period]), ResultSum, resultAvg)
@Tali_USA
I would recommend always use a date table and make a relationship with your fact table. That makes the time intelligence calculations easier. Moreover, it’s best practice to always slice your data by you dimension table (date dimension in this case). I applied this as well in the new attached file.
I have done that for you in the attached file. Additionally, I extended the date table. It started in 2020, but you have dates in your data sample before that period. So in the PQ I changed start date 2020 to 2019. After that I created the relationship and adjusted the calculation slightly.
I have done this for the SOLO dm measure. Please use this one as reference now.
I think this is correct. I will attached an excel file in which you can verify whether it’s correct or not.
I hope you can follow it, if not; feel free to ask, I am happy to help
Excel file:
Check Solution.xlsx (12.7 KB)
PBI file V2:
Report Sample Solution DM V2.pbix (3.0 MB)
Kind regards,
Pim Meesters
Thanks for your reply Pim,
I checked both files you sent me and the formula is still pulling August data. I am trying to pull data in all months that have been completed… which in this case would not include August. The DAX you created works perfectly if I were to take into account current Month.
For Example… the average in your formula shows 1,754,467 but should be 1,803,474. Since the month hasn’t ended yet, it throws off the final results. Is there a way to add a VAR to calculate only closed months? I tried finding some in the forum without any success.
Also, I linked my data to an extended date table as you suggested.
Thank you
@Tali_USA
Ahaa, I think i understood you wrong at first.
See attached file. I think this should the job.
Report Sample Solution DM V2 (1).pbix (3.0 MB)
I also put this link here for reference: Solved: Only display data up to previous month (or sum YTD… - Microsoft Power BI Community
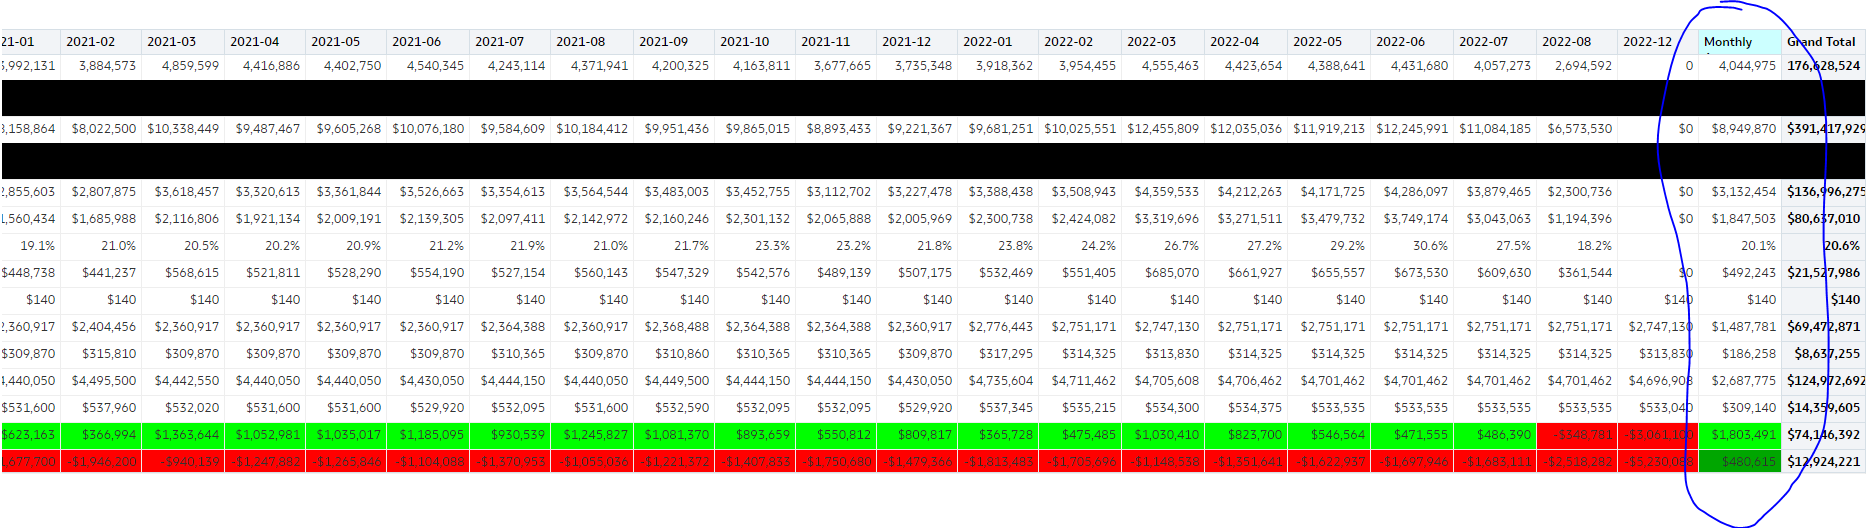
Yess this is great! It worked for all the columns that have data in them and no negative numbers. I did notice that the ones that have $0 as a value are not being counted. For example, in the print below, I’ve circled the ones that have several months with $0 and are not being included in the calculation, which in turn throws off the end result. I did some researching and saw that an ifblank statement with a +0 at the end could be added to resolve this, but it didnt change my result. I read that a summarize function could be the issue but that wasn’t included in your formula. I also removed the <>0 but also didn’t change anything.
How could I have the month with zero dollars be counted in the formula?
I appreciate your guidance on this!
@Tali_USA
See attached file.
I have made two measures for SoloT value, as you probbaly can observe in the new file.
Your first requirement was that zero’s wouldn’t count: all the totals only for the months that has values greater than zero, so that the way I implemented in the previous files I send.
In the file in this message you can see the count zero and don’t count zero measures. So whatever you wishes are, I think this file will do just fine :).
Report Sample Solution DM V2 (1) (1).pbix (3.0 MB)
Kind regards,
Pim Meesters
Well that was simple… I was trying to remove other parts of the formula! Thank you!
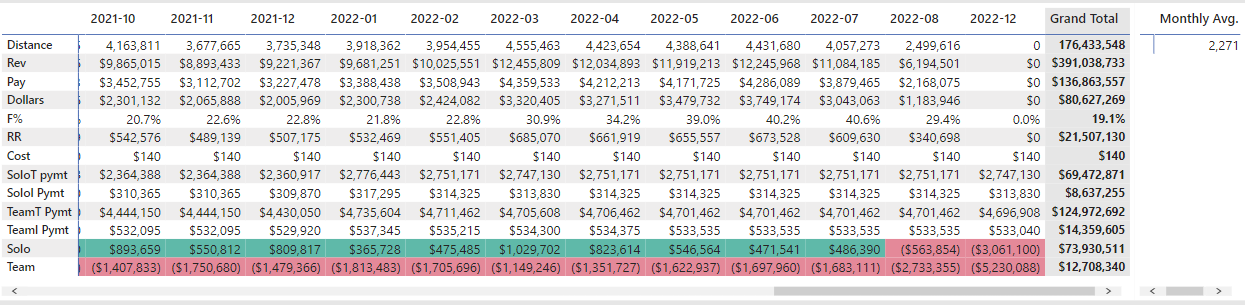
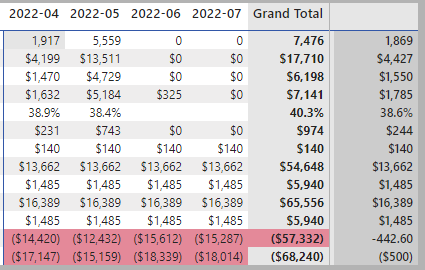
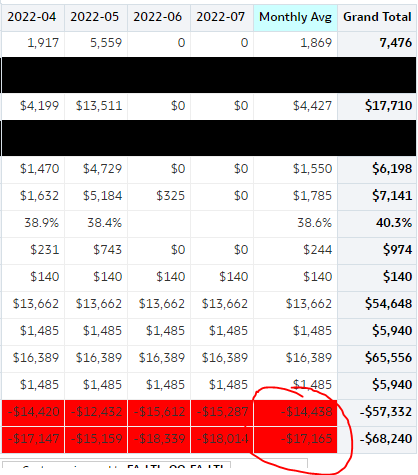
As for the negatives, I’m not understanding what is being calculated. I tried recreating the result by exporting the data. The bottom two rows only have negatives and the averages are completely off:
This is the correct result:
I’m thinking this is also a quick and easy fix?
@Tali_USA
Please show a more specificied screenshots. At what values am I looking in your screenshots? ( Distance, solo… etc? )
We get more negative values in the SOLO and Team CashFlow metrics. I’ve attached the spreadsheet values I am seeing. You can see that the average in the spreadsheet is correct (remembering to exclude current month data) but the result in the Dax formula is completely off.
data.csv (7.2 KB)
@Tali_USA
I am lost on your request to be honest.
What is the solo cashflow and team cashflow? I can’t find these values , neither in my own file, neither in the file you provided in your orignal post. Additionally, I can’t the encircled numbers in red a previous posts ago.
Could you clarify / elaborate on your request? or share the files you are looking at
Sorry for my confusing reply to your earlier question Pim.
The solo and Team cash flow were just examples of two metrics that have negative values in them. Here is an excel file showing the correct averages versus what is in Dax.
The excel file shows correct avg for the Solo CashFlow because there aren’t any negative values being calculated. But you’ll see that the team CashFlow is completely off because all the values in prior months are negative and the averages are not being calculated correctly.
I also added the DAX formula in the file for reference.
Thank you
data.csv (8.4 KB)
@Tali_USA
See attached files.
I have added a Team measure (Team DM) and this also contains a lot of negative values, but average is correct (see excel file).
If it still isn’t fixed, please provide the PBIX file you are using and only view the things that are not correct, to keep the file clear.
Hope this helps
Kind regards,
Pim Meesters
1 Like
Hi @Tali_USA , did the response provided by @DashboardingMeesters help in solving your query? If not, how far did you get and what kind of help you need further? If yes, kindly mark as solution the answer that solved your query. Thanks!
Hi @Tali_USA, due to inactivity, a response on this post has been tagged as “Solution”. If you have a follow question or concern related to this topic, please remove the Solution tag first by clicking the three dots beside Reply and then untick the check box.
Hi @Tali_USA, due to inactivity, a response on this post has been tagged as “Solution”. If you have a follow question or concern related to this topic, please remove the Solution tag first by clicking the three dots beside Reply and then untick the check box.