I am having some bit of an issue trying to put everything together here. I am trying to get an average count of employees who are present by month.
I have an employee table:
BuildingID
EMPID
Enter Date
Leave Date
101
4556
1-Jan-21
10/4/2021
105
5664
22-May-21
10/4/2021
109
6772
12-Apr-21
10/4/2021
113
7880
1-Mar-21
10/4/2021
117
8988
22-Jul-21
10/4/2021
121
1009
11-Mar-21
10/4/2021
125
1120
30-Jan-21
10/4/2021
129
1231
20-Jun-21
10/4/2021
133
1342
8-Feb-21
10/4/2021
And then I also have another table that I use to record employee absences,
BuildingID
EMPID
Absent Date
101
4556
13-Sep-21
101
4556
10-Sep-21
101
4556
18-Sep-21
101
4556
19-Sep-21
101
4556
9-Sep-21
101
4556
7-Sep-21
101
4556
15-Sep-21
101
4556
8-Sep-21
105
5664
23-Aug-21
105
5664
22-Aug-21
I also have a calendar table which is included in the file. I am trying to create a matrix table with building in the row, months in the column, and calculate the Average Number of Employees Present in a month.
I have tried to create a summarized date table and create indexes to get employee count but it did not work as I was visualizing. I am attaching a sample copy below.
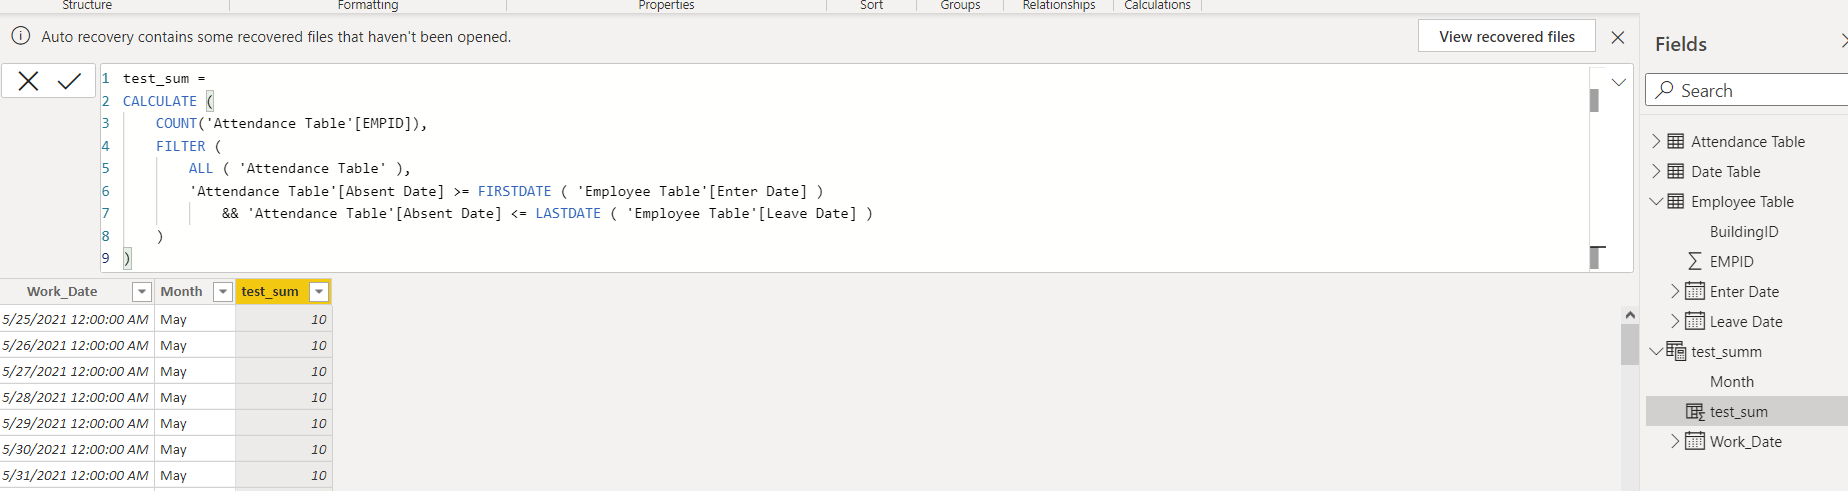
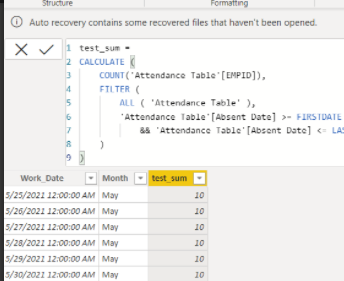
I am also attaching a screenshot of my work below.
I am a bit confused with your model and what you are trying to achieve. It would be helpful to see a mocked up version of the result you wish to achieve.
In the first table, what is enter date? Is this the date they entered the leave request? why is that in the employee table?
Then the second table has some leave in Aug & Sept. Technically they would all be present sometime in the month so there isn’t an average. Do you want average number in a building on a workday?
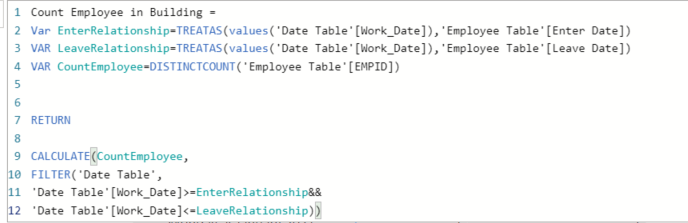
However, this screenshot might help. It’s a summarized table. However, I am also trying to bring in the Building ID column here. I am still figuring out how to do that.
I am trying to get the Building ID, Work_Date,Month, test_sum(counts the number of employees absent), and another column that would show the counts of the number of employees on that particular building.
Hi @supergallagher25, It’s great to know that you are making progress with your query.
Please be reminded that asking more than one question in a forum thread and asking question after question in the same forum thread around the same project or piece of development work is considered inappropriate.
You can create a separate thread for your other questions related to this inquiry so that other users can easily check the details of your queries.
Hi @supergallagher25, we’ve noticed that no response has been received from you since October 8.
We just want to check if you still need further help with this post? In case there won’t be any activity on it in the next few days, we’ll be tagging this post as Solved.
Hi @supergallagher25, due to inactivity, a response on this post has been tagged as “Solution”. If you have any concern related to this topic, please create a new thread.