(EDIT 14th Jan 2022: StaffData [Finish Date] fixed to match sample hours)
How do I calculate 1month 2month and 3month average of hours per Team A B C?
I especially don’t know how to calculate the Employee ID distinct count over time. For example on 1/12/2021 the count will be 4 people. I was hoping to use this on denominator and divide sum hours.
The way PowerBI average function works in general just bends my brain. Thanks for help in advanced.
From perspective of you current measure AvHours - it’s ok except Team B.
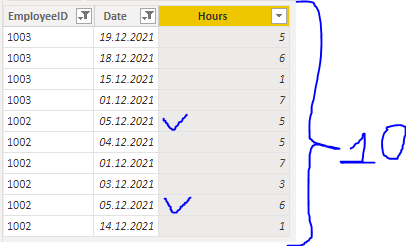
The calculation is sum of hours (46) divide on row numbers - wich is in table view equal 9, but inside Table “StaffHours” is 10 because of Employee Num 1002 who on the date 05.12.2021 has two rows values for 5 and 6 hours.
So, first recommendation:
use GroupBy in Power Query to merge these two values and then you’ve get correct table.
Then, in case you want to have correct values in DAX w/o PQ.
As you mention, the idea is to calculate some distinct value. Not people, as you can see on picture in December Team B has only two of them. But - count rows numbers in the virtual table.
In attached file i’ve added new measure called AvHours1:
AvHours1 =
VAR _CountRows =
COUNTROWS(
– this function counts rows
SUMMARIZE(
– here i create virtual table wich merge the issue with Employee 1002 on the 05.12.2021
‘StaffHours’,
‘Dates’[Date],
‘StaffData’[Team],
‘StaffHours’[Hours]
)
)
RETURN
– and just get clear calculations as the end
[sumHours] / _CountRows
To see values for 1 or 2 or 3 months you could use slicers (as in attached file)
Thanks for your work on this. Sorry I made a mistake in the dummy data with StaffData[Finish Date] so have fixed this in the latest edit.
The ID count I don’t think is right - it should be relatively constant and only change when an Employee Starts or Finishes. Similar to this youtube solution. I can’t use this youtube solution unless I merge the start finish data into the fact table unless I’m missing something.
And I want to compare each team average on the same line graph if possible.
Hi, @izzleee
Thanks for update!
I did some work, so you could find the result in attached file.
What i’ve added:
Measure “AvPerTeam”
This one calculates average hours per Team per day
For ex.
Team B
Sum of Hours in December, 2021 - 46
Days with Hours values in December - 8
Result - 46 / 8 = 5.75
Measure “CurrentStaff”
Similar the solution on youtube provided by Sam and EDNA team
I just take the freedom to present a second, slightly different solution, I hope you do not mind (but without the graphs)
(see also attached PBIX AverageProblem v3.pbix (1.8 MB)
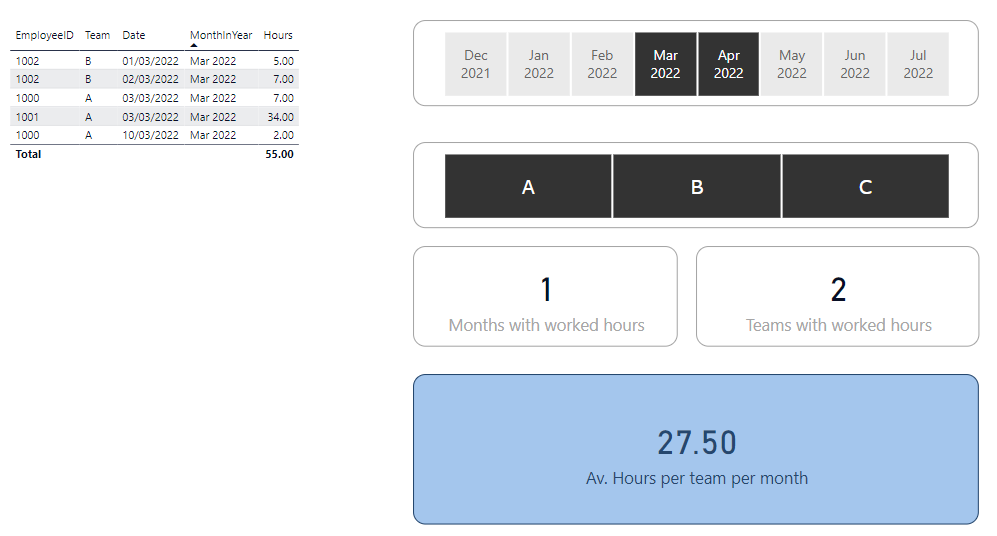
The formula divides the total hours by teams with staffhours and months with staffhours, based upon the selection made. The count of the months and teams involved can be made with the formula Countrows i.c.w. Summarize as stated below:
Av. Hours per team per month =
Var DistinctTeamsInStaffData =  COUNTROWS(
                                    SUMMARIZE( StaffHours , StaffData[Team]))
VAR DistinctMonthsInStaffData = COUNTROWS(
                                    SUMMARIZE( StaffHours , Dates[MonthInYear]))
return
DIVIDE( SUM(StaffHours[Hours]), DistinctTeamsInStaffData * DistinctMonthsInStaffData,0)
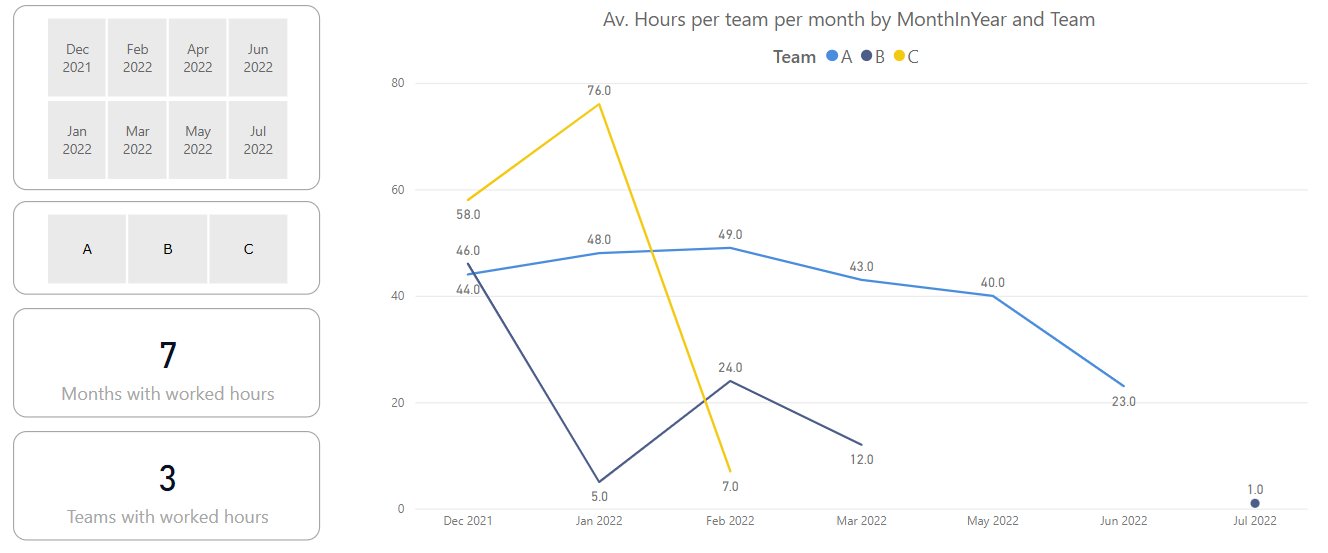
PS: the PBIX has two pages : “Audit” as before, with an added page “Line Report” (see above)
The slicers on both pages are the same, but by default independent , so you can still check the individual values per month in the Audit page.
Hope this helps you further, kind regards, Jan van der Wind
P.S. As I am not aware of your average information requirements, just a note as I love simplicity : for this particular line graph as stated above, also a base measure like " Total hours = SUM( StaffHours[Hours]) " will give the right results, as the context is detailed with “MonthInYear” and “Team”. In this particular graph are in fact Totals to be presented, not Averages.
 because of Employee Num 1002 who on the date 05.12.2021 has two rows values for 5 and 6 hours.