Here is my PBIX file:
AverageCheck.pbix (228.7 KB)
This is a follow on question to average hours per team over time. I wasn’t clear for exactly what my question was.
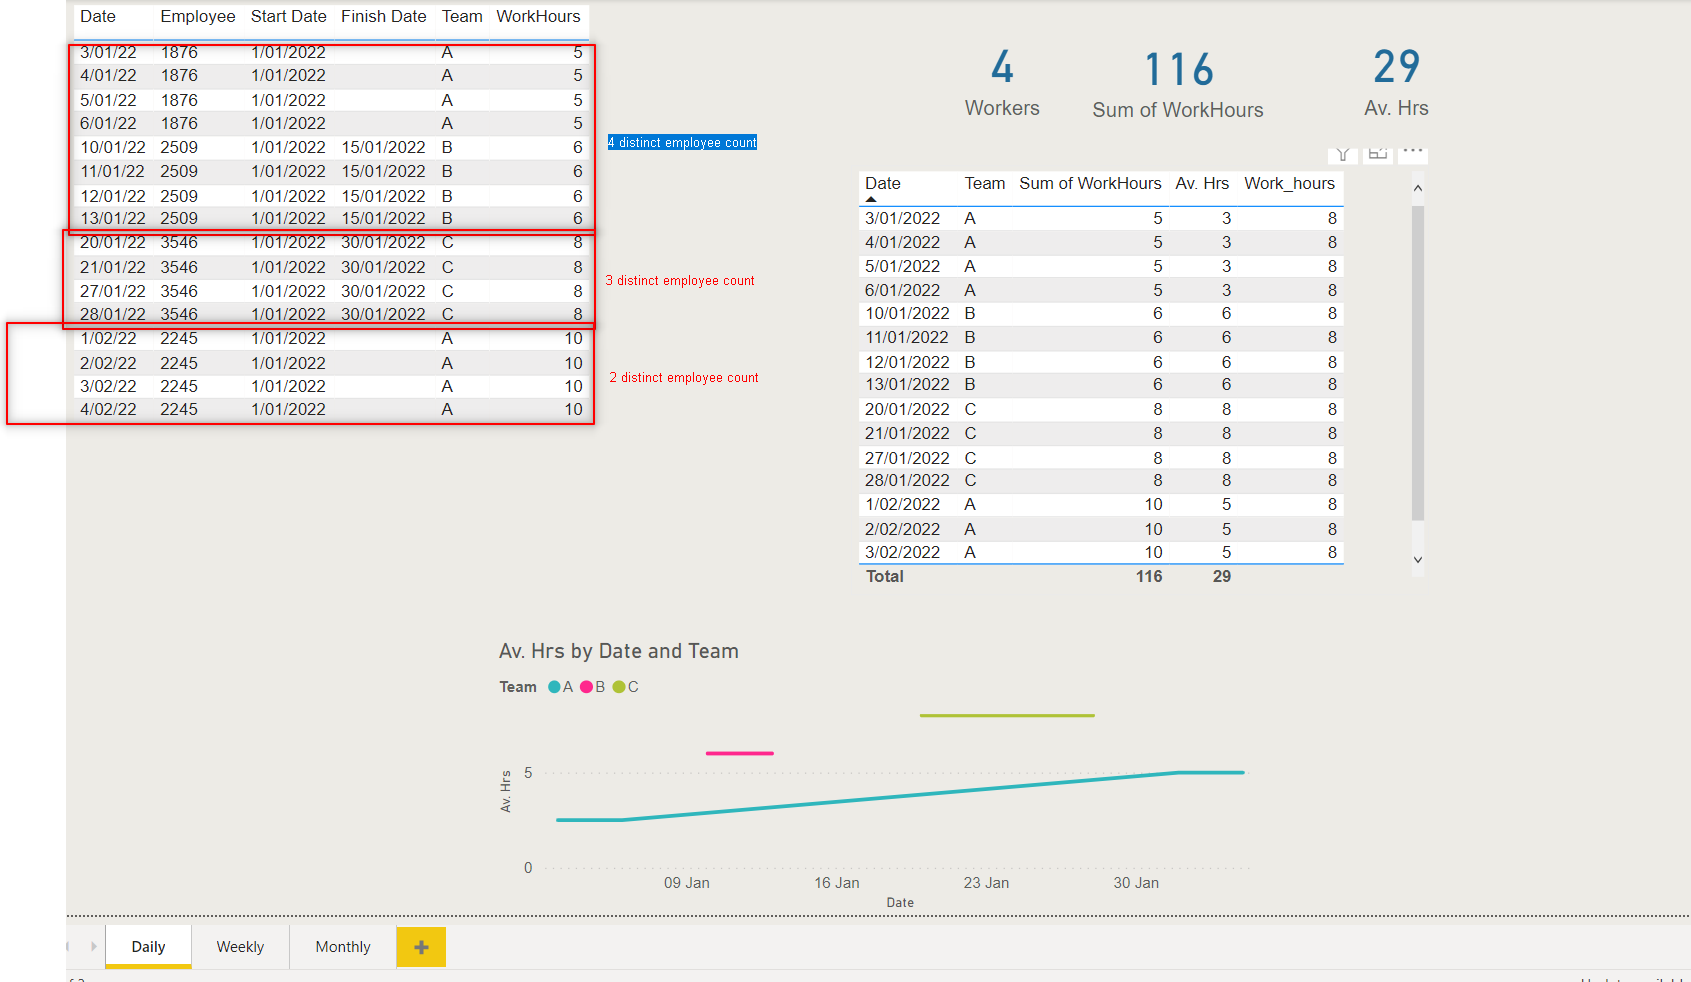
I have 3 teams working over January. One team member resigned (Bernice) on 15th January so my total staff count dropped from 4 to 3 on 16th and another resigned on 30th Jan so the count dropped again from 3 to 2. Each Employee with StaffData[FinishDate] = blank means they are currently employed and should be counted.
Problem 1.
How to calculate a dynamic, distinct count of employees? The employee count changes depending on how many employees are currently employeed:
This Average shown in the screen shot of 29 is not correct.
Problem 2.
each non-holiday shift is 8hrs. Using Date[Weekhours] and Date[Work_hours] how can I calculate the percentage average for week and month worked? for example one full week without holidays = 5 days * 8 hrs = 40hrs = 100%. I want to represent this visual on the line graphs with week average %, month average % and 3 month average %
Thanks in advance
Hi @izzleee
Please receive hereby a solution for problem 1 and 2.
PBIX attached:
AverageCheck v2.pbix (202.7 KB)
Problem 1 :
-
A distinct count of employees based upon selected dates can be done with a Crossjoin, whereby both the Start Date and the Finish Date should be taken into account (as all employees start at 2022 in this example, 2021 count should be zero)
Count employees =
    CALCULATE (
        DISTINCTCOUNT (StaffData[Employee]),
          FILTER( StaffData, AND( OR(StaffData[EmployeestartDate] <= MIN(Dates[Date]), isblank(StaffData[EmployeeStartDate])), //1 start empl on,before first date in range, or blank
                                    or(StaffData[EmployeefinishDate] >= MAX(Dates[Date]),isblank(StaffData[EmployeefinishDate])) )),  // AND 2 last date employee on, after last date in range or blank
          CROSSJOIN(values(Dates[Date]),values(StaffData[EmployeeStartdate])),
          CROSSJOIN(values(Dates[Date]),values(StaffData[EmployeeFinishdate])))
-
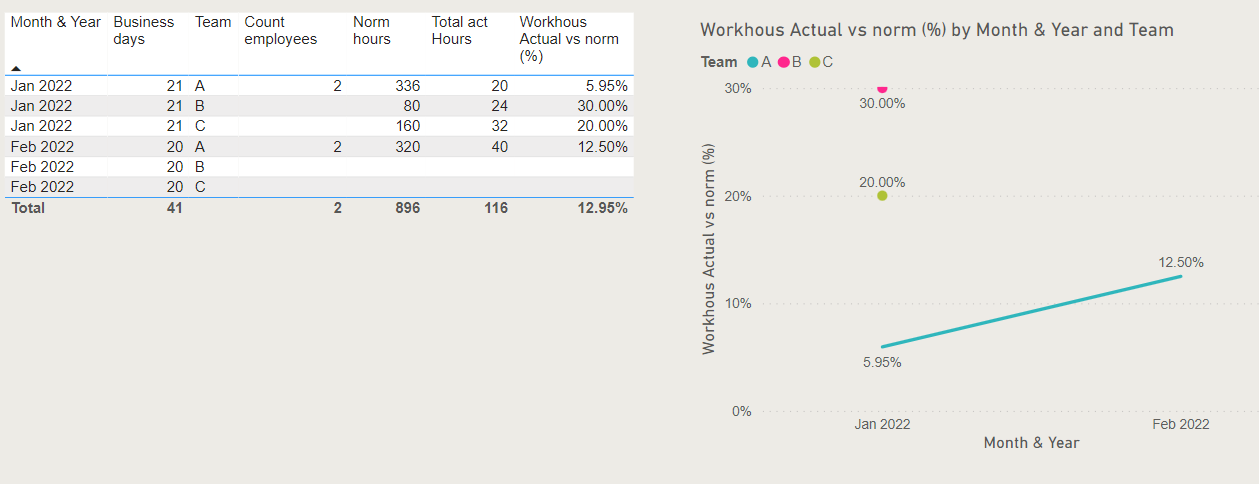
Note: Count Employees gives the number of employees available at the end of a selected period. If within this example the monthly period January is selected, the number of employees is 2 (started with 4), as 2 persons has left before the end of the month.
However Norm hours (see below) are calculated per day as the SUMX funtion is used, which calculates the norm row by row (day by day)
Problem 2 :
-
In my opinion the requested percentage is defined as actual hours divided by norm hours.
Set up Dax formulas are :
Total act Hours = SUM(HoursData[WorkHours])
The norm is defined as 8 hours per business day (as defined in the Dates table, which excludes weekends and holidays) multiplied by available employees.
Norm hours = SUMX( Dates, Dates[Work_hours] * [Count employees]) //workhours are based upon Business days from the Dates Table.
Actual vs Norm %
Workhours Actual vs norm (%) = DIVIDE( [Total act Hours], [Norm hours], 0) //normhours based upon Business days
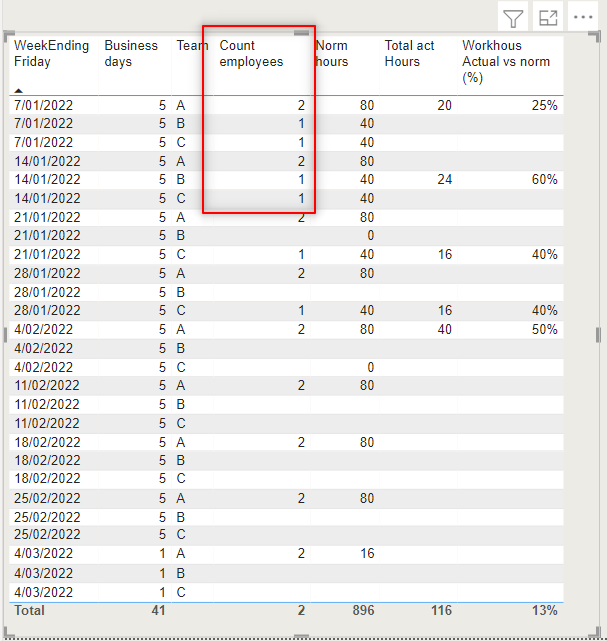
Graphs can be made per Week ending on Friday, or per Month or per Quarter, below a Monthly report, together with the data:
Note 2 : Measures can be found in measure group “DS Measures” and 3 reporting pages are added to the PBIX file.
If you have further questions or remarks, please let me know. I hope this helps you further.
Kind regards Jan van der Wind
1 Like
Wow thankyou Jan.
I’ll look into cross join thanks to this. I haven’t considered this before.
I see the count is actually context dependent so in this case is just split across teams. Great work.
Many thanks!
1 Like