Applying two slicers from the same field on Table visual

I am comparing the spend of various Customers across the selected Products (in Slicers) but the context is not applying correctly… What am I doing wrong?

See the example below:

Table: Products

image

Table: Customer

image

Slicers & selected values:
image

DAX Formula:

Total Sales: image

Total Sales (P1 & P2):

The output Table visual:

Table 1: Total Sales

Table 2: Total Sales (P1 & P2)

I was expecting to see the records only for Product 1 & Product 5 across all Customers in Table 2. I have also attached the PBIX file for reference.

Thanks for your help in advance.

Multiple filters from same column on a Table.pbix (521.8 KB)

1 Like

Forgot to mention that I have removed the Interactions from both “Product Name 1” and “Product Name 2” slicer to the Table visual so the data in the table is displayed. If I don’t do this, then both the slicers are applied on the table and no data is returned (as expected).

why do it in such a complicated manner… why not just have the slicer on product name with multiple selection option turned on . PBIX File attached with the updates.

File attachedMultiple filters from same column on a Table.pbix (517.0 KB)

I have multiple visuals (in addition to the Table) displayed for each Product… if I do a multiple-select in a slicer, then the numbers get aggregated for all selected Products instead of splitting by each Product in other visuals.

Product 1 & Product 5 Selected:

image

Product 1 Selected:
image

Product 5 Selected:
image

As you see in the above example, I want to see the Total Order for each selected Product…this is not possible if I have one Slicer. I have whole bunch of visuals to be displayed for each selected Product as I want to compare the insights between the products.

This works if I hard-code the Product Names in DAX but that is not scalable and optimal. Hope the problem statement is clear.

@brjeeth,

You can still get the results you want with a single slicer as @C9411010 recommends. You’ll just need to use a multicard visual and format it to look like multiple separate cards:

491D5BA3-CAF6-4687-B477-0F317E47E0AA

  • Brian

P.S. Great initial post - clearly laid out the problem, explained the results you wanted to achieve, and provided visuals and a PBIX. This really helps those responding on the forum provide prompt, specific solutions. :+1:

2 Likes

@BrianJ: I agree with the proposed solution if I’m only displaying card visuals. I have cards with various metrics (Ex: Spend, Count, Average, etc) along with other visuals like Bar Chart, Doughnut, Matrix, etc… I am going to convert the Table visual to Matrix (Customer in rows, selected Product in Column, metric value based on the metric selection from the user as values)…all this is to help compare various measures across the selected Products.

I want the visuals to be static but data to be dynamic based on the user select. Would appreciate if you can help me solving this problem…I tried different variations and can’t think of a way to solve it.

@brjeeth,

Have you taken a look at the Showcases section of the portal? As a member, you can download the PBIX files for any of the showcases and see exactly how @sam.mckay put them together. There are a number of them that focus on comparative product analysis that seem like they are right in line with your requirements. I’ve screenshot just a couple that I think would be relevant for you to look at.

  • Brian

@brjeeth

You’ve said that you’re “expecting to see the records only for Product 1 & Product 5 across all Customers” , but I noticed your DAX formula uses “||” which is an ‘or’.

Have you tried changing the “||” to a “&&”?

@BrianJ: Thanks for direction…I did see both these Showcases and in both scenarios, the Visual is same and when we there is a multi-select of Products, the data is aggregate for all the selected Products instead of displaying separate visuals (one for each selected Product). Hope this explains better.

@samaguire: When we apply AND (&&), ideally none of the Products should return as a given point Product cannot be both Product 1 and Product 5. However, I did give it a try and there is no change in data as the context is getting applied. See the screenshot below:

@brjeeth,

Super interestingly, this brings us full circle back to our conversation a few days ago about the use of slicers built on disconnected tables, connected virtually to the relevant fact table(s) via TREATAS.

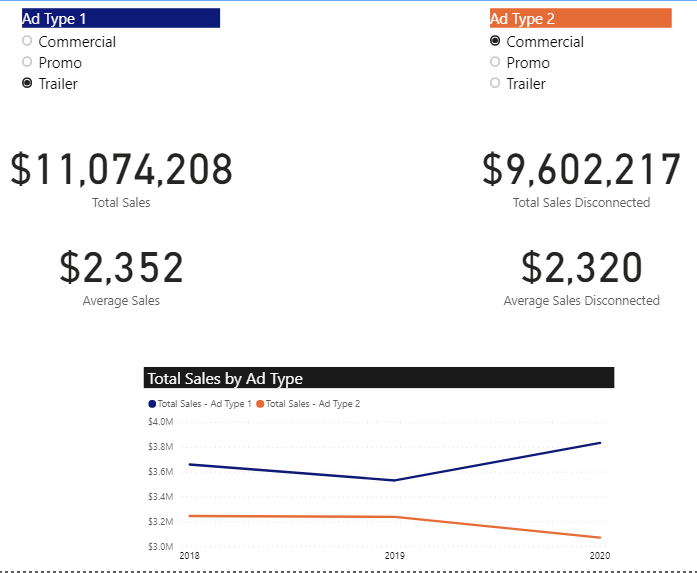
We can use that exact same technique here - Ad Type I is a normal slicer based on Ad Type, while Ad Type 2 is based on our disconnected table. The left (blue) side of the comparison uses “normal” measures since the Ad Type 1 slicer comes from a field connected within our data model, while the right (red) side adds an additional TREATAS statement to each measure to virtually connect the Ad Type 2 slicer to the Sales table:

Total Sales = SUM( Sales[Line Sales] )

Total Sales Disconnected = 
CALCULATE(
    [Total Sales],
    TREATAS(
        VALUES( 'Disconnected Ad Type'[Ad Type] ),
        Sales[Ad Type]
    )
)

Here’s what it looks like all put together:

See, I told you those techniques would come in handy… :wink:

Hope this is helpful. Full solution file posted below.

3 Likes

Never realized the applications of TREATAS…this solution worked. I have just started learning PowerBI and falling in love with it. Thanks for your prompt responses with awesome solutions!

One last question, can I Rank by one measure and display another measure (Ex: Get the Top 10 Customers Sales but display the number of Products they have purchased )?

@brjeeth,

It is pretty addictive, isn’t it? Really glad to hear that solution worked well for you.

With regard to your next question, that’s definitely doable. However, per the forum guidelines once a topic is considered solved, additional questions should be asked in a new topic. So, if you could please just start a new topic with your ranking question, that would be great.

Thanks.

  • Brian

Will do…Thanks!!

Wow! I have been looking for this technique for several days. Thanks for the comprehensive solution. I never used TREATAS before but it’s becoming my new friend :slight_smile:

@Amr ,

Wow - this one’s a blast from the past! Glad you found it useful. I had a similar experience - It took me a while to get comfortable using TREATAS, but once you do you begin to see applications for it everywhere.

– Brian