I would like some assistance regarding an aggregation issue I have noticed across multiple Power BI Dashboards I have created
I usually confirm my results in Power BI with Excel, this was how I noticed an aggregation issue or bug.
I have noticed that the sales values for a specific month matches correctly with my Excel Check file, however, the problem arises when these sales values are aggregated across months. The values aggregated over months does not match the Excel check file. The values are relatively close but not exactly the same.
Any form of help would be much appreciated.
Thank you
Hi @Akshay_05,
Welcome to the Forum!
Can you provide a sample PBIX showing the issue and separately the expected outcome?
You can use techniques shown in this video to mask any sensitive data. Providing a file and clear problem description is by far the best way to get forum members involved and help you work out a solution.
Welcome to the forum and thanks for posting your question @Akshay_05. To receive a resolution in a timely manner please make sure that you provide all the necessary details on this thread.
Here is a potential list of additional information to include in this thread; demo pbix file, images of the entire scenario you are dealing with, screenshot of the data model, details of how you want to visualize a result, and any other supporting links and details.
Including all of the above will likely enable a quick solution to your question.
Hi @Akshay_05, did the training content provided by @Melissa help you solve your query? If not, how far did you get, and what kind of help you need further? Thanks!
Good Day 
Apologies for the delayed response - I was busy trying to duplicate the problem using “dummy” data. The aggregation issue is still a problem. I have developed a .pbix example dashboard (See attached). I have also developed a pivot calculation file in excel using the same data (see attached). What appears in the Excel check file, represents the correct solutions. I have highlighted the problem in Excel (the cells highlighted in yellow does not match the values in Power BI). Please let me know if the problem is clear in the Excel check fileDNA Dashboard Example.xlsx (485.7 KB) DNA Enterprise Example Dashboard.pbix (168.8 KB) .
Your help is much appreciated
Hi @Akshay_05,
For issues with Totals, you can check these resources:
Hi Melissa,
I have tried to implement the DAX formulas presented in the videos attached.
I am still getting the same result as before.
Any help will be appreciated
Thanks
Hi @Akshay_05,
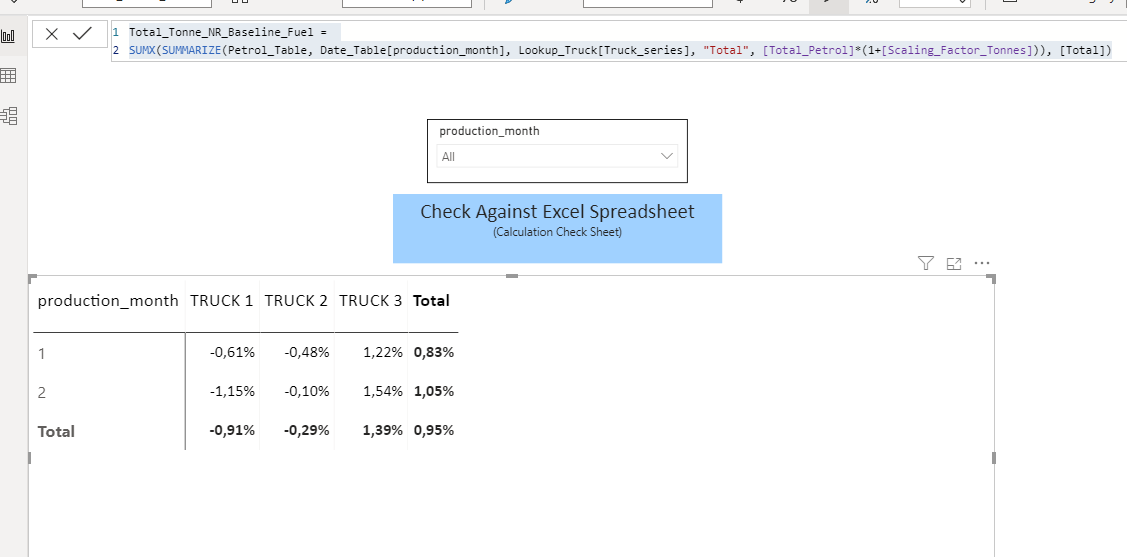
You need to perform the calculation group in order to fix the total, like:
Total_Tonne_NR_Baseline_Fuel =
SUMX(SUMMARIZE(Petrol_Table, Date_Table[production_month], Lookup_Truck[Truck_series], “Total”, [Total_Petrol]*(1+[Scaling_Factor_Tonnes])), [Total])
I believe there are more measures to be changed in order to fix the totals.
1 Like