Hi
Please help on how can I have three totals in a Matrix visual based on a formula. Here is an example.
Thanks
Hi
Please help on how can I have three totals in a Matrix visual based on a formula. Here is an example.
Thanks
Hello Namjan,
Are you doing this based on a Rolling 12 Month to just show recent 12 month results or are you working with a Fiscal Year that runs July to June?
That will help with giving you the best results.
Andrew
Hi
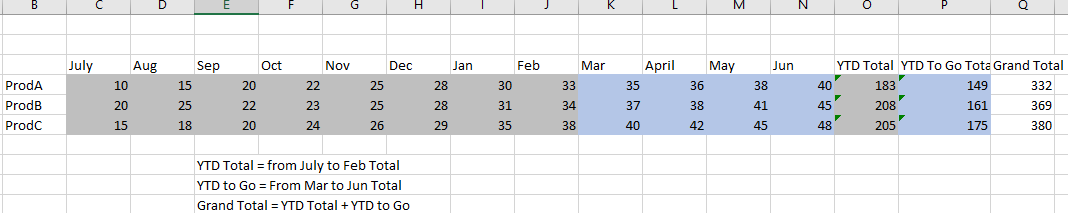
we are using Fiscal months. But not able to figure out the dynamic totals. YTD Total is till current month. YTD to Go is for months remaining and How to add this to a matrix visual. as on Columns we are month Fiscal months.
Thanks
So your ‘YTD to Go’ is projections or estimated?
remaining months total in the year. Say it current month is Feb. then YTD to go is remaining months from Mar to Jun. We already have these measures.
My problem is how to show the total measures( YTD Total, YTD to go, Grand total) on the matrix table. next to the Month as shown in screen shot above.
Thanks
It will unfortunately require a measure per Column for you to mimic that same layout within Power BI.
I have done this before where I had to create a Measure for each year to show a Table containing each year along with additional columns like you are trying to do here.
When you are originally from Excel and creating Table reports like that, you cannot mimic everything the same within Power BI. It can require you to change you thought process on how you present results on your Report Page. That can be tough because then you usually are also trying to show something different to bosses that don’t like change.
An alternative that is not ideal, but could be a short term solution:
-create a Matrix showing all of your results per Month (this should be straight forward having your Product in Rows, Month in Columns, and Values being your 1 SUM Measure
-then you would create a Table and put it on the right of that Matrix, but now you can insert your Product and each of those YTD Measures.
-make sure Text Wrap is turned off of the Column headers in your 2nd Table and you can adjust width of the product column to make it hidden. Then make sure both the Matrix and Table are Sorted the same by Product (A-Z I presume) and this should keep your results lined up and the viewer wouldn’t know they are in separate tables
Hi
Thanks… That’s what I was thinking but wanted to explore if there is a better solution.
Thanks for your help
I would love to find that same solution allowing 1 Measure broken out by Month and allowing more than 1 other Measure on the end showing different results. If you find it, let me know 
Hi
I think it is the visual limitation. We need to find some other visual who can do this.
Thanks
Best option may be to create a Measure per month of your current Fiscal Year and do those individual measure within a Table, not Matrix. That will at least allow you to put all Measure including the multiple YTD’s within the same visual. Also by doing each Measure based on Fiscal Month or the Current Fiscal Year, it will automatically update for you when the new Fiscal Year hits and you wont have to go changing each Measure to fix anything.
Or make it based on a SELECTEDVALUE within a Slicer where you choose the Fiscal Year you want to view.
Hi @NamJan, I’ve come across this issue before in a Sales Forecasting and Operational Planning model. I’m assuming that your data consists of actual values and forecast values which has a date context to them? That is, your actual revenue occurs from a point (less than today) and your forecast values from that point forward (greater than today).
To achieve what I think you are after, you will need to specify a point in time. I achieved this in my SFOP model with a Month/Year slicer which, prior to that point my calculation uses Actual sales and forward uses forecast sales.
The formula created to choose Actual or Forecast sales looks like this;
’ [Act or Fcast] = ’
SUMX (
    DISTINCT( 'Date'[Month Year] ), // for each Month Year
    IF (
        ISFILTERED ( 'Parameter'[Act to  Month] ), // Para Table = Mar 2019
        IF (
//if Calendar Date < Parameter date use Actual.
            CALCULATE (
                MAX ( 'Date'[Calendar Date] ) )
                    <= CALCULATE (
                        LASTDATE ( 'Parameter'[Calendar Date] ),
                        ALL ( 'Date' )
                    ),
               Actual[Sales],
                CALCULATE(SUM('Fcast Values'[Fcast Sales]))
            ),
//if unfiltered then only use Actual
           Actual[Sales]
        )
    )'
I hope this helps.
Hi Steve
Sorry for replying back late. Got into some other issues. Now back to the same report
If possible could you please explain with an example. I am enclosing a sample Excel file to better understand the issue.
Thanks for your help
SaleData.xlsx (10.4 KB)
Hi, Please find attached a Power BI Model with DAX calculations included. Hope it helps.SalesData Model.pbix (139.4 KB)
Hi Steve
Sorry still confused. when I am clicking the months on page 1 the values are not changing
I have added a page 2 to the Report. Say for example my current month is May 2019( not a slicer selection), my YTD formula is : sum values from Jan 2019 to May 2019… and YTD_TOGO is remaining months in the year : June 2019 to Dec 2019.
Similarly Next Month the YTD formula will change automatically to show : Jan 2019 to June 2019 and YTD_TOGO will be July 2019 to Dec 2019. Hope I am clear.
Thanks for your help ( enclosing a sample excel sheet and the report)
SaleData.xlsx (10.6 KB)
SalesData Model.pbix (147.2 KB)
Namjan,
What you were clicking on was a harvester slicer used in the DAX formula “Act or Fcast” to decide from which months the Fcast sales will be used. Remember, in the data, there are actual sales to Mar (in 2019) while there are Fcast sales for each month through to 2020. The calculation swaps Actual for Fcast results in the total depending on the month chosen but, will only do so where there are “actual” values.
I’ve updated the model to amplify the difference between Actual sales and Forecast Sales and extended actual data to Apr. I’ve also included measures for YTD Actual Sales, Year to Go Sales and EOY Sales Fcast. Hope this helps.SalesData Model (1).pbix (131.1 KB)
Hi Steve
Thanks for your help. I will take a look and update the post.
----Update—
Just saw the file… Looks perfect. one question on below formula
YTD Actual Sales =
TOTALYTD([Actual Sales Value],
'Date Table'[Date],
FILTER('Date Table',
ALLSELECTED('Date Table'[Year])
&& LASTDATE('Date Table'[Date]) = LASTDATE('Actual to Month Table'[Date])))
The sample is using the slicer ( I believe to show how the numbers change if we change the month) and I can replace the last line " LASTDATE(‘Actual to Month Table’[Date]) with my current month flag.( which gives me the current month name…) Am I correct ?
Thanks
Hi NamJan,
I’m not sure without seeing the model. However, all the measure is doing is using an external constraint (Month_Year from the harvester slicer) to define an end date for the TotalYTD function.