Adding a slicer based on Measure

Hello,

I need to create a slicer (same as below screenshot) to filter my table visuals based on the indicators used on my Measure which named (Indicator), the Measure is in a text format.

Looking to have the below slicer:
image

A screenshot of my current table:

Indicator Slicer

I’ve used the below measure to get my indicators:

Indicator =
IF([Total Sales]=0, “Missed” ,
IF([Sales LM]=0, “Attracted”,
IF([Total Sales] > [Sales LM],“▲”,
IF([Total Sales] < [Sales LM], “▼” , " " ))))

Appreciate any support!

Reg,

Welcome to the Enterprise DNA Forum @Haitham . We’re happy to have you in the community. To get started, I highly suggest you check these guides that Sam created for us to build a more collaborative environment. How To Use The Enterprise DNA Support Forum (https://forum.enterprisedna.co/t/how-to-use-the-enterprise-dna-support-forum/3951)

Hello @Haitham,

Thank You for posting your query onto the Forum.

Could you please upload the working of your PBIX file? so that members of our forum can assist you better.

Thanks and Warm Regards,
Harsh

@Haitham,

Welcome to the forum – great to have you here!

Power BI doesn’t support slicing based on measures, only columns. While there are some clever workarounds to that restriction, I don’t think they will be useful here. Instead, what I would do is to create a “pseudo-slicer” based on buttons linked to page navigation actions. You can also do this using bookmarks, but I find the former approach both more flexible, and easier to implement and maintain.

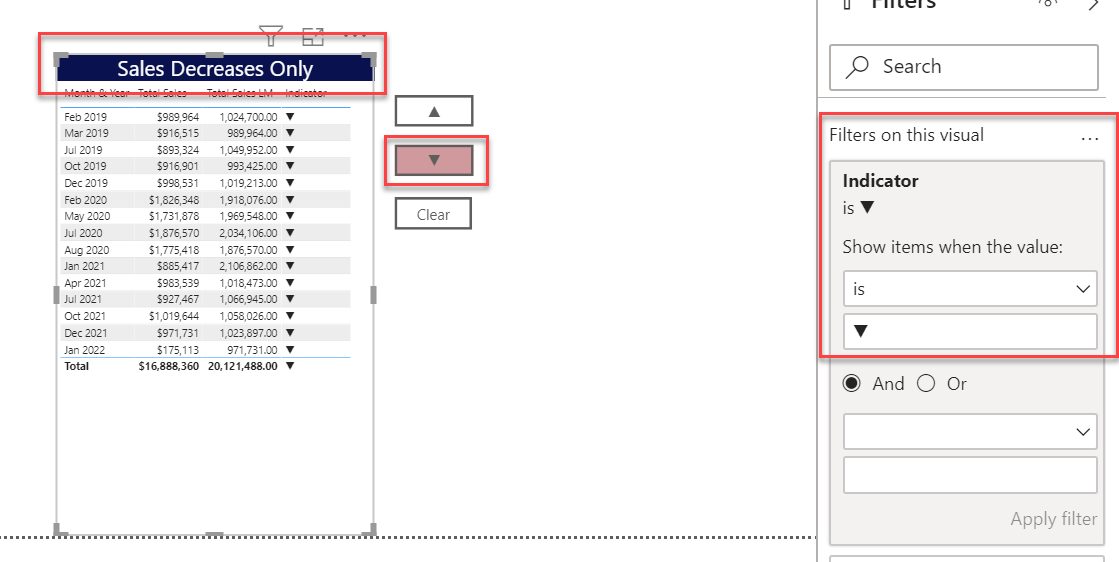
Basically, what you want to do is create buttons with each of your “slicer” options on them, then duplicate your main page – 1 for each button. Then on each page set the filter condition to the appropriate value matching the button on the relevant visual, and hide every page except the unfiltered “home” page. For example, the filter condition on the down button would look like this:

One of the nice things about doing this via page navigation is that you can format any aspect of the page to change with the button selection – page backgrounds, button colors, visual titles, etc., etc.

I’ve just done a simple mockup using increase, decrease and clear. Check it out below in published form – I think the action and user experience is really smooth.

I hope this is helpful. Full solution file posted below.

  • Brian

eDNA Forum – Pseudo-Slicer Solution.pbix (531.2 KB)

P.S. Instead of multiple nested IF statements, I think it’s clearer to write the measure as a SWITCH(TRUE()) construct:

Indicator = 
SWITCH( TRUE(),
    [Total Sales] = 0, "Missed",
    [Total Sales LM] = 0, "Attracted",
    [Total Sales] > [Total Sales LM], "▲",
    [Total Sales] < [Total Sales LM], "▼",
    BLANK()
)
2 Likes

Hi @Haitham.

I think you can achieve what you’re looking for with an [Indicators] supporting table instead of a measure. Once a calculated column using @BrianJ’s formula is included in the [Sales] table, you can link the [Sales] and [Indicators] tables. Does this help?

_eDNA Forum - Adding a Slicer based on Indicator - 1


Greg
eDNA Forum - Adding a Slicer Based on Indicator.pbix (23.9 KB)

4 Likes

@Greg,

Well, sure - your method works too for people who prefer to do things the easy and sensible way…

I plead temporary insanity.

  • Brian
4 Likes

@BrianJ and @Greg

Thank you so much for your support.

It’s still not goes through both options. @BrianJ I’m not that familiar with “pseudo-slicer” and have tried using your file but it’s not working probably.

@Greg you’re absolutely right, this will definitely will help if using the a calculated column which is no the case.

The point here is that I’ve created a measure instead of a calculated column for the (Total Sales, Change MoM and Change MoM %). The working file that I’m using have all the dates in one single column.

To have more clarity on my scenario and as requested by @Harsh, please have a look to the below working files.

EDNA Working File.xlsx (68.3 KB)
EDNA (Check File).pbix (718.2 KB)

I’m not sure what part of the file is not working for you, but if it’s the buttons, please make sure to hold down CTRL when you click on a button in the Desktop. In the published Service version I sent, you can just click directly.

  • Brian

@Haitham,

Thanks for providing your PBIX and data files – that’s really helpful in providing you the best support possible. If your report had only one table, then @Greg’s approach clearly would’ve been the most efficient way to get to the outcome you want. However, seeing the specifics of your report, with four tables across different evaluation contexts, I’m now thinking that my measure-based “pseudo-slicer” approach isn’t insane, and is actually the way to go here. The only change you would need to make is instead of applying the filter pane condition at the visual level, you would apply it at the page level instead – thereby filtering all four tables at the same time based on the indicator measure value.

@Harsh and @Greg - what do you think?

  • Brian
1 Like

Yup … @BrianJ’s page-level slicer and buttons is a solution for multi-visuals … good luck.
Greg

@BrianJ Thanks for the support, it’s now working perfectly (I missed to hold down the CTRL key :sweat_smile:)

Thank you all @BrianJ @Greg @Harsh

Reg,

@Haitham,

Great - glad to hear that’s working well for you now.

  • Brian