Interesting challenge
I have a matrix with 4 measures. It is really slow. What I want to do is to allow the users to chooose which of the measures is shown.
What the solution must do is to allow the user to select 1 to all of the 4 measures. The Matrix shown will then reflect the selected measures.
I have tried to use a slicer to allow the users to select the measure(s). Then I used the slicer to short - circuit the calculation. This did not improve the performance.
This leaves me with Bookmarks. With 4 measures that could mean 16 bookmarks. Thats ok. However 16 buttons does not look good.
Is there a way to use a measure for the bookmark to be activated? That way I can work out which measures are required from the slicer. Use a measure to create the bookmark name dynamically.
That is an interesting problem. The idea of maintaining and routing through 16 bookmarks makes me queasy.
Have you considered doing this via page navigation buttons to hidden pages? What I’m thinking about is something akin to the “pseudo slicer” approach I discussed here:
What you could do is something of a nested version of this, where the first level button selection is “How many measures do you want to include?” This would then bring you to an intermediate page with another set of buttons representing the different measure combinations, based on your first choice. Then, selection at the second level would route you to a specific personalizable page, with the matrix based on the measures selected.
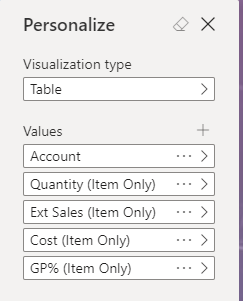
Question - are you using the “Personalize Visuals” feature available in PowerBi, where the user can actually choose what they are seeing on a certain visual? (as below)
Or, by personalize, are you meaning the slicer to select measure option?
if it’s the latter - I suggest investigating the new Personalize Visuals feature. You can set only certain visuals (such as one table in the report) to be personalized. This feature has just moved out of preview into GA.
Seems that you may need to do some optimizing of your report
First, take a look at how many visuals are on the page that is taking forever to load. This means EVERYTHING, how many cards, how many buttons, how many tables (visible and not).
Next, look at your DAX - do you have any measures thart are extremely slow?
The reason I ask, is that I have what I call a ‘playground’ report for my management team to use, and everything in that report can be personalized (except for a couple of text fields where I’m providing tips on why adding certain measures to the visual may not be a good idea). And all the pages render super fast, but I have only 2-3 visuals on each page.
@Heather
Thanks. Been down the road of looking at the data model. Currently I have managed to only supply 50% of what they want so not a good start.
Based on that the Performance Analyxer is howing 10,000 ms to render one visual (Matrix) and 8000ms in total for four charts.
This is the first page so needs to give an overview and an impact. Current impact is to sit back and wait.
This attempt is to reduce the measures in the Matrix which from testing will allow the Matrix to render quicker.
Running out of options again to speed this up.
Thanks
E
I recall seeing a trick about this recently, where you can change the transparency value of an item based on a measure. Let me dig around and try to find where I saw that…
The way to make a button visible or not based on a measure is through conditional formatting - so far, that is the only way I have seen to make any color transparent.
The trick is, that you will need measures for each of the button states - so if your button is normally formatted to look different on press or hover, you’ll need to have measures to cover that as well.
And if your model is already struggling, I don’t know if adding measures for each state of the button, and for each feature (outline, text, fill, and possibly icon) is it worth it?
I was trying to build a quick mock up for you of how this would work, and got quickly frustrated by the number of measures just to demonstrate this:
The alternative, is to add the measure to the color of the text, so something like:
Masking Button Text =
VAR Color = “B3B0AD”
VAR Transparent = “FFFFFF00”
RETURN
IF( [Sum Total] < 15, Color, Transparent )
The addition of “00” at the end of the color code makes it transparent, and I just use the FFFFFF code (white) for convenience.
Note that this method requires a different measure for each color used in the button.
The color measure is applied in the Visualization options - click the fx button:
Would adding a measure that is for button visability add to the model in a substantial way? In my head I would have thought that it would be minimal impact.
So it looks like we can do this but we are adding a lot of maintenance as the report gets developed over time.
Chris Webb had an interesting post on this issue a few weeks ago:
The performance hit may come primarily from the visuals themselves, even if they display no data, rather than the measure(s) that controls the transparency.
@BrianJ
Thanks,
will go through that again. I think I read that recently. Looking through Performance Analyzer the visual content is low.
So on my Matrix the
DAX Query is 8,121 ms
Visual display is 125 ms
Other is 3,339 ms
Total is 11,585
Total for the Page is circa 29,000 ms
This is a little distorted as I am sure there is some data flows refreshing. But this is just one user and I am sure its just going to go down hill.
Thanks
E
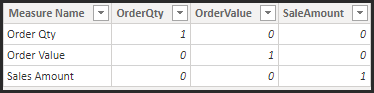
I am not sure if it will work for you, but I created a sample report, where the user can decide using a slicer whether the measure will perform the Dax calculation or simply return blank. See attached:
The report has a helper table which contains the measures you wish to control and which the user will select from. It then also has columns for each of those measures, so using a SUM you can determine if each one is selected or not (there may be easier ways of doing this?)
I then used the following DAX for each measure. This essentially checks that a measure has been selected (required as a default slicer doesn’t seem to offer the option of Force Selection) and then checks that the measure in question has been selected. If it has then run the DAX of your time consuming measure.
Order Qty =
// Original DAX measure = SUM(Sales[OrderQty])
var __IsFiltered = ISFILTERED('Measure Options'[Measure Name])
var __IsSelected = SUM('Measure Options'[OrderQty])
RETURN
IF(__IsFiltered,
    IF(__IsSelected <> 0,
        SUM(Sales[OrderQty])
    )
)
@Mark
Thanks. Been through that option. It has to surface the data quicker and adding a slicer comes with a cost, and what you gain by short circuiting the calculation you lose by surfacing the slicer.
The feedback to the users has been “this is as good as it gets”
This will start an uncomfortable discussion but looking at the spec for the next report that one will make this one look really fast.