Hello
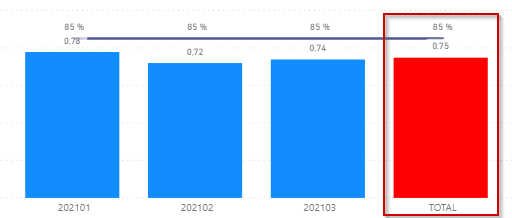
I have a requirement to add the cumulative total to an histogram. The graph is analysed by Year, Month and measures Total and Target. Note the request is not to add the Cumulative Total as a line but as a bar. The Cumulative total should change color to red if below Target and Green if above.
For now I have two solutions to propose to the client but I would like to ask you all if you had a similar request before or if you have other solutions to propose,Problem_Description.pbix (57.8 KB)
The solution involved : 1) Creating a new dimension with the necessary columns I needed in the target graph and added the “TOTAL” value - UNION used. 2) Readjusted my base measure to calculate accordingly taking into consideration the TOTAL value. 3) Used ranking to order the graph so the Total value shows always at the end 4) Followed this Youtube video https://www.youtube.com/watch?v=zHzSBNES6jE&t=265s for the color coding of the Total value (if above or below the Target)
Hope this information helps someone with a similar problem in the future