Hi @Harris ,
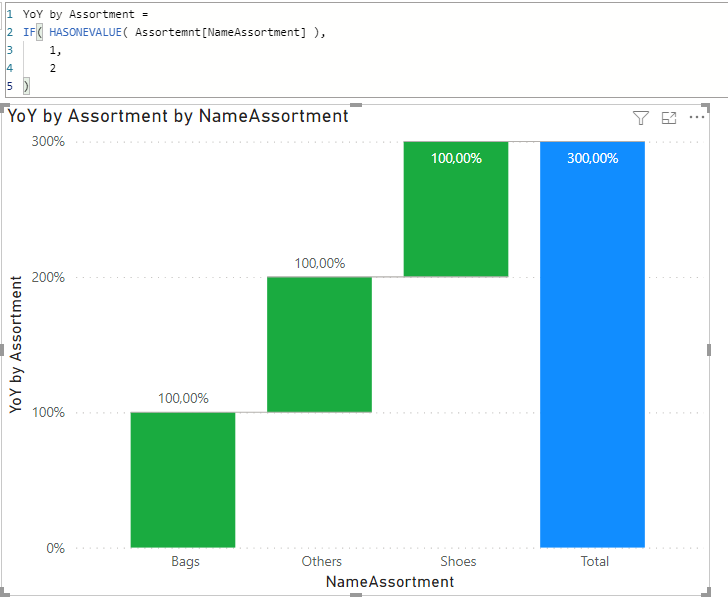
The total is the correct sum of all parts and there doesn’t seem to be a way to controll that Total bar in a Waterfall chart… Think you might have to look for an acceptable alternative
.
If a Bar chart is an option, you may find this topic intresting.
Hi
I managed to solve my problem by following this Youtube video
https://www.youtube.com/watch?v=nVvlEHKr_0o .
The solution involved : 1) Creating a new dimension with the necessary columns I needed in the target graph and added the “TOTAL” value - UNION used. 2) Readjusted my base measure to calculate accordingly taking into consideration the TOTAL value. 3) Used ranking to order the graph so the Total value shows always at the end 4) Followed this Youtube video https://www.youtube.com/watch…
I hope this is helpful