Hi @Roger , (v2)
Interesting problem.
- For the DDB-calculation is required: acquisition amount, salvage( 0) , life (total periods) , and every single individual depreciation period.
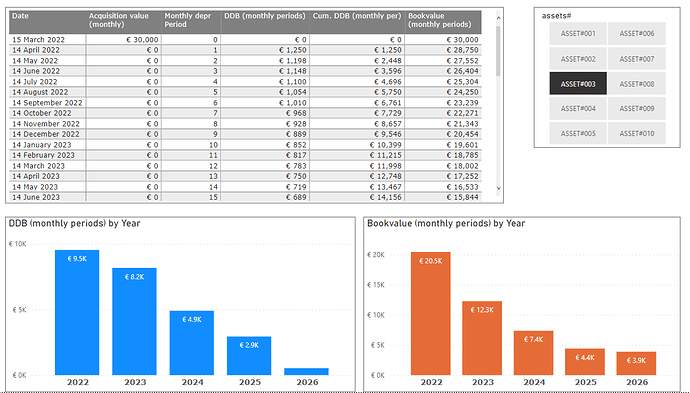
- Presumably requested reports: DDB, cumulative DDB and book value over time.
Concept of a solution:
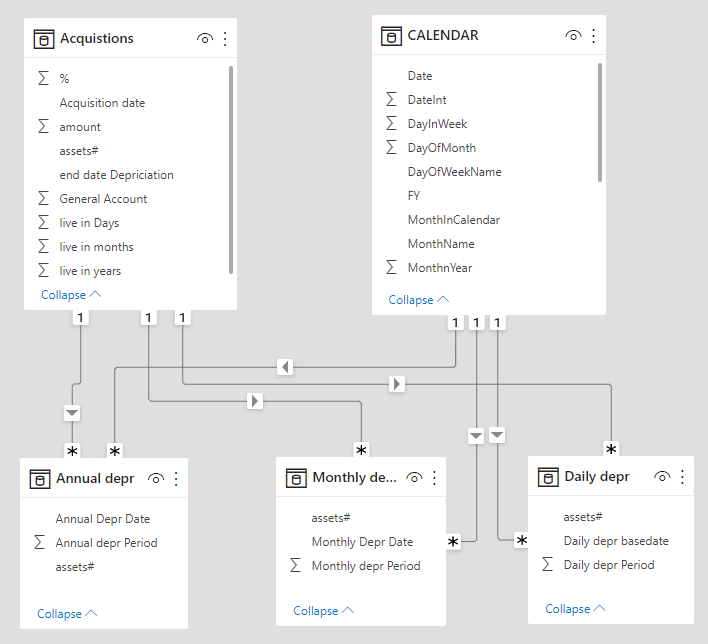
- In my opinion, it is necessary to create a table with each individual depreciation period and date for all assets (as the individual periods are not available and a necessary input for the DDB-calculation); three tables in this case, for Days, Months and Year periods.
- When connecting those tables with a date table and the asset table, relative straight forward measures can be generated to calculate periodic DDB, cumulative DDB and book value of the assets to generate reports.
The workout of the concept:
-
PBIX attached:
depreciation assets v3 def.pbix (359.6 KB)1. Generate tables with depreciation periods and dates for every asset for every period
(annual, monthly, daily, based upon the asset table in Power Query (see Monthly table below)
Explanation :
-
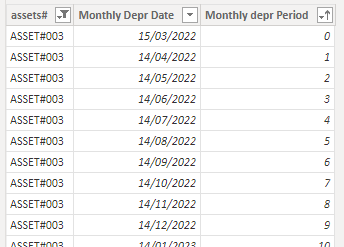
With Power Query the original “Acquistions”-table is expanded with the given live periods (“live in months”) for each asset.
-
With the expansion a depreciation date is added, reduced with one day (Month and Year depreciation), to get the (in my opinion) correct depreciation date (see example above), additionally the acquisition date is added (period 0), to be able to add the acquisition value to the book value.
-
The required depreciation period (for DDB) is added, using the technique of creating an index per Asset.
-
The expansion is done for three depreciation periods (Day, Month, Year), tables “Daily-”, “Monthly-” and “Annual Depr”
Used Power query code for the Monthly period table:
let
    Source = Acquistions,
    CreateDates = Table.AddColumn(Source, "Monthly Depr Basedate", each let myDate = [Acquisition date] in if ([live in months]) >1 then List.Transform( {-1..([live in months]-1)}, each try Date.AddMonths( myDate, _ ) otherwise Date.EndOfMonth( Date.AddMonths( #date( Date.Year(myDate), Date.Month(myDate), 1), _ ))) else {[Acquisition date]} ),
    ExpandDates = Table.ExpandListColumn(CreateDates, "Monthly Depr Basedate"),
    DeprDateCalc1 = Table.AddColumn(ExpandDates, "Monthly Depr Basedate2", each Date.AddMonths([Monthly Depr Basedate],1)),
    DeprDateCalc2 = Table.AddColumn(DeprDateCalc1, "Monthly Depr Date", each if([Acquisition date] =[Monthly Depr Basedate2]) then [Monthly Depr Basedate2] else Date.AddDays([Monthly Depr Basedate2],-1)),
    LinDeprCalc = Table.AddColumn(DeprDateCalc2, "Linear depreciation", each if([Acquisition date] = [Monthly Depr Date]) then 0 else [amount] /[live in months]),
    #"Grouped Rows" = Table.Group(LinDeprCalc, {"assets#"}, {{"Asset", each _, type table [General Account=nullable number, #"assets#"=nullable text, amount=nullable number, #"%"=nullable number, live in years=nullable number, Acquisition date=nullable date, end date Depriciation=nullable date, live in months=nullable number, live in Days=nullable number, Monthly Depr Basedate=date, Monthly Depr Basedate2=date, Monthly Depr Date=date, Linear depreciation=number]}}),
    #"Index by Asset" = Table.AddColumn(#"Grouped Rows", "IndexByAsset", each Table.AddIndexColumn([Asset],"Monthly depr Period",0,1)),
    #"Removed Other Columns" = Table.SelectColumns(#"Index by Asset",{"IndexByAsset"}),
    #"Expanded IndexByAsset" = Table.ExpandTableColumn(#"Removed Other Columns", "IndexByAsset", {"General Account", "assets#", "amount", "%", "live in years", "Acquisition date", "end date Depriciation", "live in months", "live in Days", "Monthly Depr Basedate", "Monthly Depr Basedate2", "Monthly Depr Date", "Linear depreciation", "Monthly depr Period"}, {"General Account", "assets#", "amount", "%", "live in years", "Acquisition date", "end date Depriciation", "live in months", "live in Days", "Monthly Depr Basedate", "Monthly Depr Basedate2", "Monthly Depr Date", "Linear depreciation", "Monthly depr Period"}),
    #"Removed Columns" = Table.RemoveColumns(#"Expanded IndexByAsset",{"General Account", "amount", "%", "live in years", "Acquisition date", "end date Depriciation", "live in months", "live in Days", "Monthly Depr Basedate", "Monthly Depr Basedate2", "Linear depreciation"}),
    #"Changed Type" = Table.TransformColumnTypes(#"Removed Columns",{{"assets#", type text}, {"Monthly Depr Date", type date}, {"Monthly depr Period", Int64.Type}})
in
    #"Changed Type"
Note 1: Thankfully used the following sources for the Power Query code:
- @Melissa, for the line expansion, see also How to generate queries in Query Editor with M Code - #4 by Melissa
- Ruth, for creating a index column per asset https://www.youtube.com/watch?v=7CqXdSEN2k4
2 Create a data model including the created three tables, the assets table and a date table
3. Generate measures for the periodic DDB, cumulative DDB, Acquisition value and book value for the three depreciation periods (Year, Month, Day)
DDB (monthly periods) = SUMX('Monthly depr' ,
                   if('Monthly depr'[Monthly Depr Period] = 0,  0, -- 0 = acquisition date
                              DDB(RELATED(Acquistions[amount]),0,RELATED(Acquistions[live in months]),'Monthly depr'[Monthly Depr Period])))
Cum. DDB (monthly per) = Var CumDepr = CALCULATE( [DDB (monthly periods)] , filter( ALLselected('CALENDAR'), 'CALENDAR'[Date] <= MAX('CALENDAR'[Date]))) return IF(ISBLANK([DDB (monthly periods)]), BLANK(), CumDepr)Acquisition value (monthly) = SUMX('Monthly depr' , if('Monthly depr'[Monthly Depr Period] = 0, RELATED(Acquistions[amount]), 0)) -- period 0 = acquisition dateBookvalue (monthly periods) = Var BookV = CALCULATE( [Acquisition value (monthly)] -[DDB (monthly periods)] , filter( ALLselected('CALENDAR'), 'CALENDAR'[Date] <= MAX('CALENDAR'[Date]))) return IF(ISBLANK([DDB (monthly periods)]), BLANK(), BookV)Note 2: the measures can be found at measure groups “DS Annual Depr measures”, DS Daily Depr measures" and “DS Monthly measures”
Note 3: as in two of the four measures “SUMX” is used, the measures gives correct values for multiple asset-selections
4. A possible DDB report of monthly DDB reporting is shown below (asset 3)
Note 4: similar example reports are made for daily DDB and annual DDB
Note 5: the date table is limited to the dates of the years 2021 - 2032, if the live period of assets is longer, results are presented in a “blank”-period.
Note 6 : the graphs are calculated instantly, the table requires some processing time
I hope this answer your information requirements, if you have further questions or remarks, let me know.
Kind regards,
Jan van der Wind

