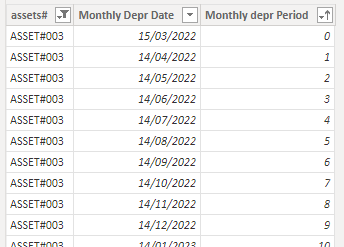
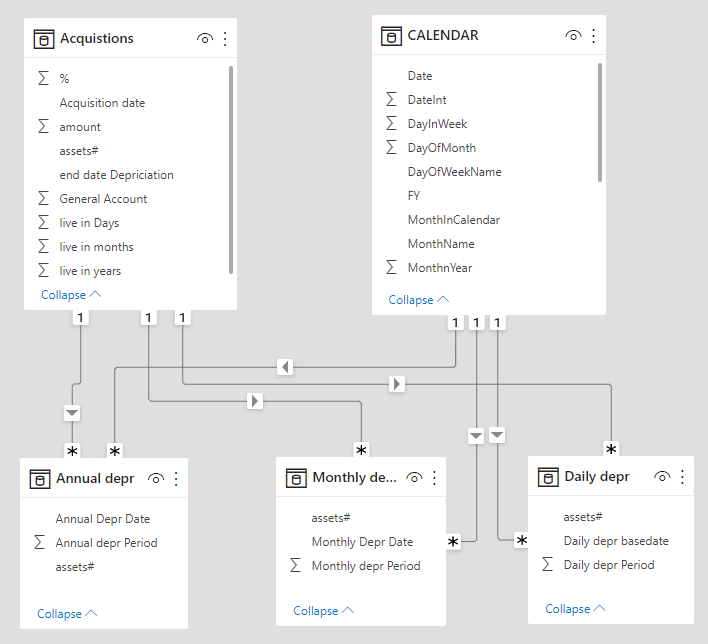
The expansion is done for three depreciation periods (Day, Month, Year), tables “Daily-”, “Monthly-” and “Annual Depr”
Used Power query code for the Monthly period table:
let
    Source = Acquistions,
    CreateDates = Table.AddColumn(Source, "Monthly Depr Basedate", each let myDate = [Acquisition date] in if ([live in months]) >1 then List.Transform( {-1..([live in months]-1)}, each try Date.AddMonths( myDate, _ ) otherwise Date.EndOfMonth( Date.AddMonths( #date( Date.Year(myDate), Date.Month(myDate), 1), _ ))) else {[Acquisition date]} ),
    ExpandDates = Table.ExpandListColumn(CreateDates, "Monthly Depr Basedate"),
    DeprDateCalc1 = Table.AddColumn(ExpandDates, "Monthly Depr Basedate2", each Date.AddMonths([Monthly Depr Basedate],1)),
    DeprDateCalc2 = Table.AddColumn(DeprDateCalc1, "Monthly Depr Date", each if([Acquisition date] =[Monthly Depr Basedate2]) then [Monthly Depr Basedate2] else Date.AddDays([Monthly Depr Basedate2],-1)),
    LinDeprCalc = Table.AddColumn(DeprDateCalc2, "Linear depreciation", each if([Acquisition date] = [Monthly Depr Date]) then 0 else [amount] /[live in months]),
    #"Grouped Rows" = Table.Group(LinDeprCalc, {"assets#"}, {{"Asset", each _, type table [General Account=nullable number, #"assets#"=nullable text, amount=nullable number, #"%"=nullable number, live in years=nullable number, Acquisition date=nullable date, end date Depriciation=nullable date, live in months=nullable number, live in Days=nullable number, Monthly Depr Basedate=date, Monthly Depr Basedate2=date, Monthly Depr Date=date, Linear depreciation=number]}}),
    #"Index by Asset" = Table.AddColumn(#"Grouped Rows", "IndexByAsset", each Table.AddIndexColumn([Asset],"Monthly depr Period",0,1)),
    #"Removed Other Columns" = Table.SelectColumns(#"Index by Asset",{"IndexByAsset"}),
    #"Expanded IndexByAsset" = Table.ExpandTableColumn(#"Removed Other Columns", "IndexByAsset", {"General Account", "assets#", "amount", "%", "live in years", "Acquisition date", "end date Depriciation", "live in months", "live in Days", "Monthly Depr Basedate", "Monthly Depr Basedate2", "Monthly Depr Date", "Linear depreciation", "Monthly depr Period"}, {"General Account", "assets#", "amount", "%", "live in years", "Acquisition date", "end date Depriciation", "live in months", "live in Days", "Monthly Depr Basedate", "Monthly Depr Basedate2", "Monthly Depr Date", "Linear depreciation", "Monthly depr Period"}),
    #"Removed Columns" = Table.RemoveColumns(#"Expanded IndexByAsset",{"General Account", "amount", "%", "live in years", "Acquisition date", "end date Depriciation", "live in months", "live in Days", "Monthly Depr Basedate", "Monthly Depr Basedate2", "Linear depreciation"}),
    #"Changed Type" = Table.TransformColumnTypes(#"Removed Columns",{{"assets#", type text}, {"Monthly Depr Date", type date}, {"Monthly depr Period", Int64.Type}})
in
    #"Changed Type"
Note 1: Thankfully used the following sources for the Power Query code:
2 Create a data model including the created three tables, the assets table and a date table
3. Generate measures for the periodic DDB, cumulative DDB, Acquisition value and book value for the three depreciation periods (Year, Month, Day)
DDB (monthly periods) = SUMX('Monthly depr' ,
                   if('Monthly depr'[Monthly Depr Period] = 0,  0, -- 0 = acquisition date
                              DDB(RELATED(Acquistions[amount]),0,RELATED(Acquistions[live in months]),'Monthly depr'[Monthly Depr Period])))
Cum. DDB (monthly per) =
Var CumDepr = CALCULATE( [DDB (monthly periods)] ,
            filter( ALLselected('CALENDAR'), 'CALENDAR'[Date] <= MAX('CALENDAR'[Date])))
return
IF(ISBLANK([DDB (monthly periods)]), BLANK(), CumDepr)
Acquisition value (monthly) = SUMX('Monthly depr' ,
                                if('Monthly depr'[Monthly Depr Period] = 0, RELATED(Acquistions[amount]), 0)) -- period 0 = acquisition date
Bookvalue (monthly periods) =
Var BookV = CALCULATE( [Acquisition value (monthly)] -[DDB (monthly periods)] ,
            filter( ALLselected('CALENDAR'), 'CALENDAR'[Date] <= MAX('CALENDAR'[Date])))
return
IF(ISBLANK([DDB (monthly periods)]), BLANK(), BookV)
Note 2: the measures can be found at measure groups “DS Annual Depr measures”, DS Daily Depr measures" and “DS Monthly measures”
Note 3: as in two of the four measures “SUMX” is used, the measures gives correct values for multiple asset-selections
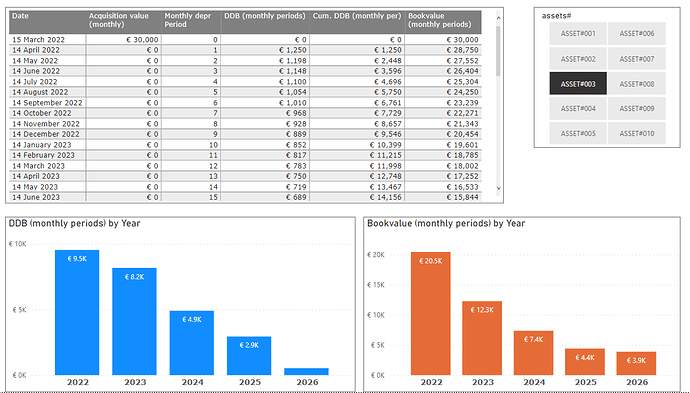
4. A possible DDB report of monthly DDB reporting is shown below (asset 3)
Note 4: similar example reports are made for daily DDB and annual DDB
Note 5: the date table is limited to the dates of the years 2021 - 2032, if the live period of assets is longer, results are presented in a “blank”-period.
Note 6 : the graphs are calculated instantly, the table requires some processing time


