Thank you Sam, excellent entry!!!
Can I have a copy of your PBI file please!!
Federico
Both entries looking cool boys, looking cool. See my entry below.
Thanks for putting this one up, @FPastor , so quickly after the last one. It’s my third one and the last bit of getting EDNA certified. Thought I’d have to wait a few more weeks for certification so thanks again.
Wasn’t sure I’d get it done in time because too much client work going on, but got there in the end and managed a round of golf this morning. @sam.mckay probably knocked his out with one hand while playing tennis with the other ![]()
The journey here was pretty tricky really; multiple Received /invoiced dates for Orders/materials made this the trickiest part. Usually I like to keep the data feed simple with little PQ and manage the DAX to make things happen. Plenty of USERELATIONSHIP here which is easy enough but the multiple date row thing was DAX difficult for me. So did a lot of the manipulation in PQ with some max dates. Once that was done - all pretty cool. Now I’m submitted I will have a look back through some of the original entries and see how the multiple dates thing was managed.
Had to double check my margin maths in Excel (yes I can still operate Excel!) because was showing very low margins. But margins were correct and business not really viable/poorly run. They probably couldn’t afford a PBI consultant. ![]()
The learnings for me here came out of the last challenge and I managed to implement them correctly:
Needed to overcome an issue I had in last Challenge with multiple bookmark navigators. Bit of a lightbulb moment once I understood the selected visuals bit on the bookmark setup menu.
I have always set my navigators at top of the canvas with slicers, but saw in last challenge that participants were putting them near to where they might be used; especially if the navigator is only for one visual. Adopted this approach and looks cool with top slicers not looking as cluttered Now got the job of revamping some of my real world solutions for this - nice touch.
But the simplest things that you don’t know are always the coolest - managed to get the hyperlink to the “Publish to Web” to work from the screenshot - Just click on the pic.
Thanks again @FPastor, just top man. Looking forward to the next one.
Pete
Hi Pete,
Welcome to “A blast from the Past - The Remake of Challenge 7”.
Brilliant to see you back with another good looking report. Yes the dataset was tricky so I do understand where you come from and the need for extra trickery with DAX and Power Query to work out this dataset. It seems that you came on top as a true champion!!!
Excellent work and well done.
Thanks and regards,
Federico Pastor
PS. Please send me copy of your PBI file for our records.
Hello everyone,
This is my submission for the one week challenge and soon I will add some comments showing the details of its development.
Good luck to all participants.
Regards,
Welcome to “A Blast from the Past - The Remake of Challenge 7”
Another excellent entry, thank you for your submission.
Best of luck.
Federico Pastor
Haha yes I did play a lot of tennis on the weekend. Needed to destress after the summit…
Hi Data Family,
Enterprise DNA “A Blast from the Past - The Remake of Challenge 7 “is now officially closed.
Another great run for the Enterprise DNA 7 days Challenge with 11 entries.
Without your participation, we cannot achieve huge milestones.
Winner and Prizes will be announced soon.
Congratulations to all participants, you have done excellently well. Enterprise DNA thanks you for your efforts and dedication.
![]()
![]() Wait there is more, Challenge 20 “Sales & Production Reporting” is one week away. A real dataset to work with, a deep dive into Sales & Production with prepared questions to be answered and an opportunity for further exploratory analysis by you, the Power BI report developer
Wait there is more, Challenge 20 “Sales & Production Reporting” is one week away. A real dataset to work with, a deep dive into Sales & Production with prepared questions to be answered and an opportunity for further exploratory analysis by you, the Power BI report developer ![]()
![]()
Well, this is all for “A Blast from the Past - The Remake of Challenge 7 “, I see you in Challenge 20 “Sales and Production Reporting”
Please joins us at https://www.linkedin.com/groups/14069197/
Federico Pastor
Hello everyone,
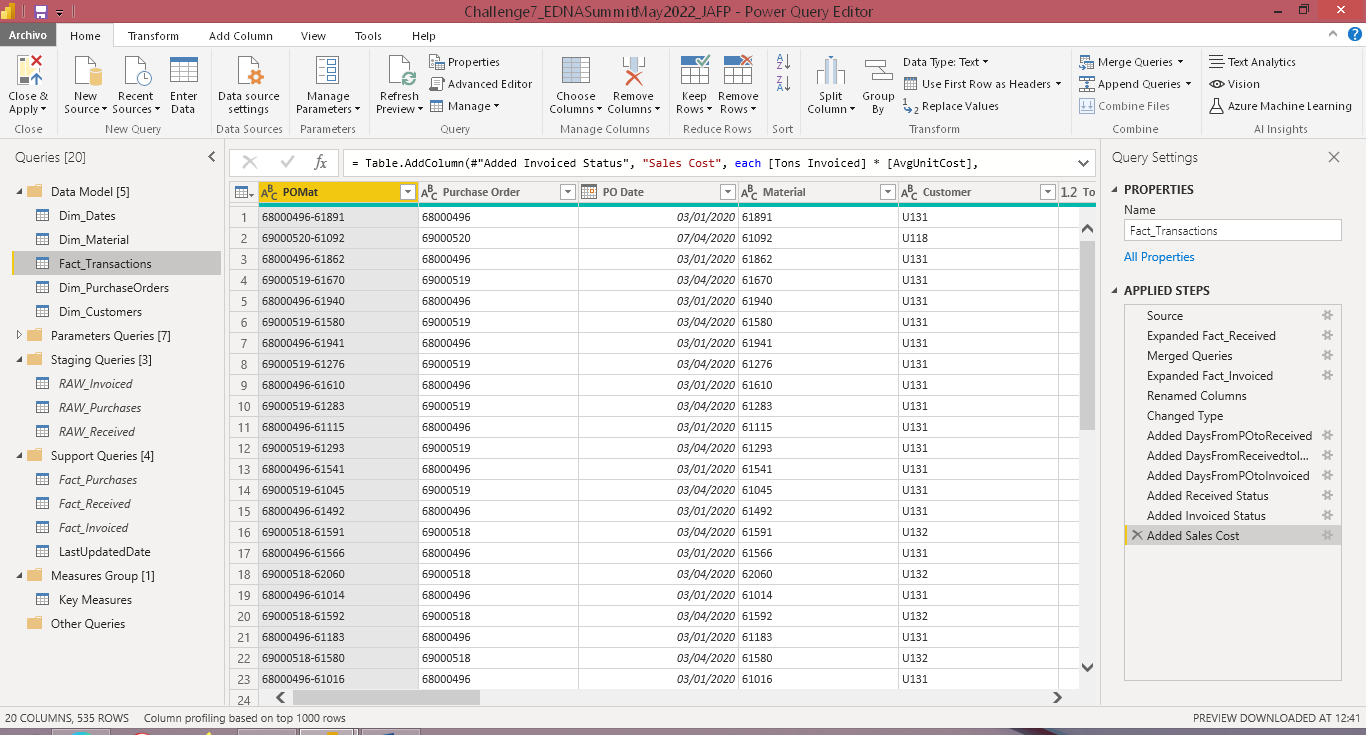
This is the development process I followed for the EDNA Challenge 7 Remake:
• Organization of queries in groups.
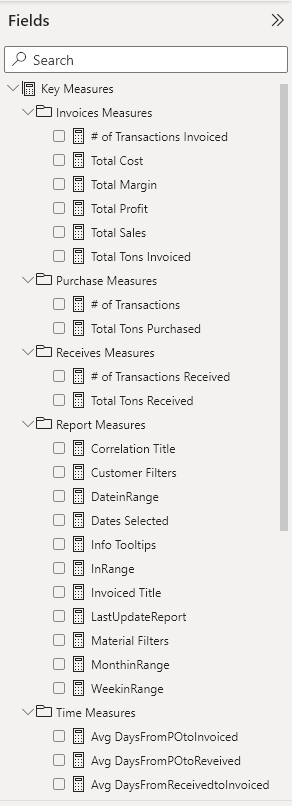
• The Dax code of all the measures I have formatted using EDNA’s DAX Clean Up.
• UI design.
For the design of the report I have used the iconography of flaticon and I have reused the theme used by @Gustaw in his participation in the EDNA Challenge 19: Call Center Data Reporting.
This is a single page report that aims to answer the following questions:
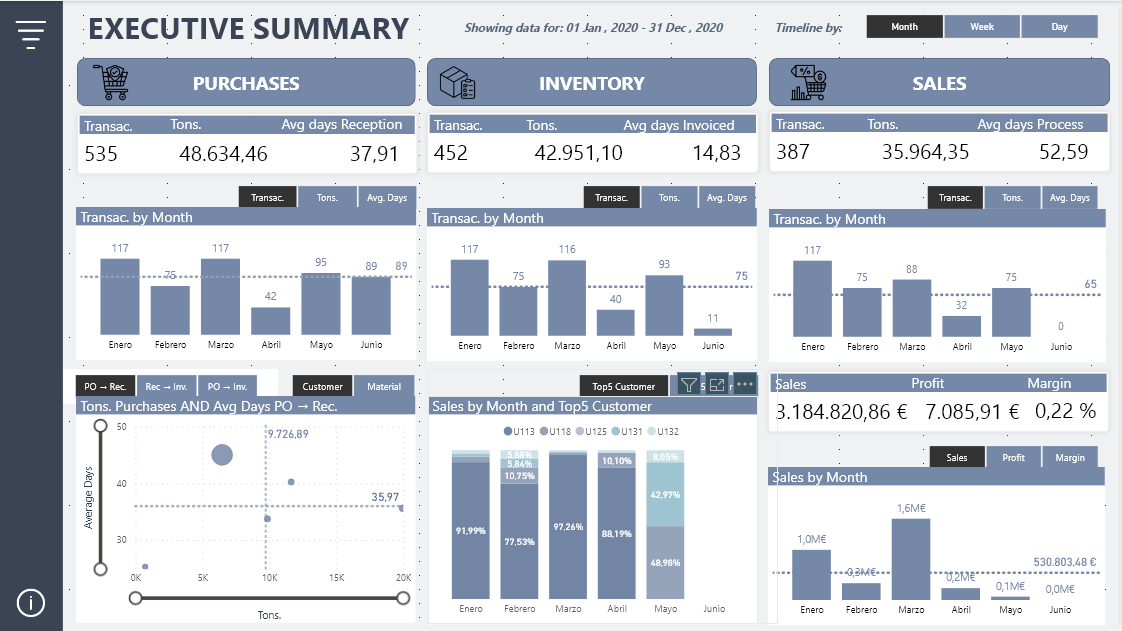
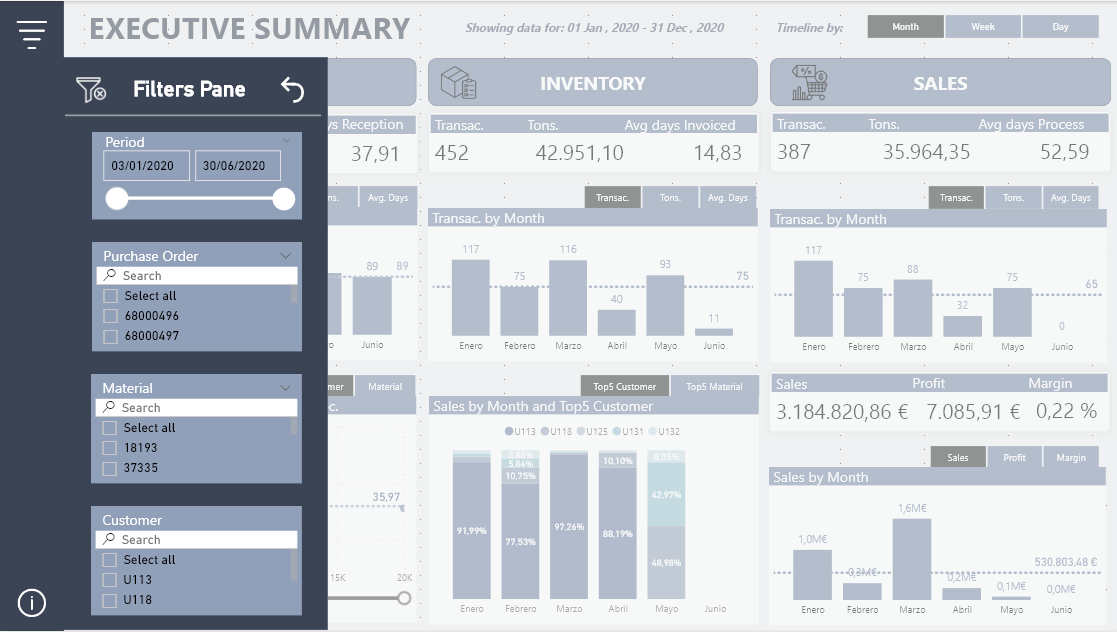
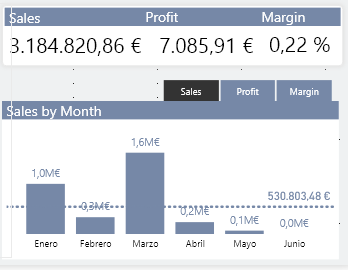
To make it as dynamic as possible, the field parameters have been used to be able to choose how we are going to display the timeline (Month, Week and Day) and what measure we are going to monitor.
![]()
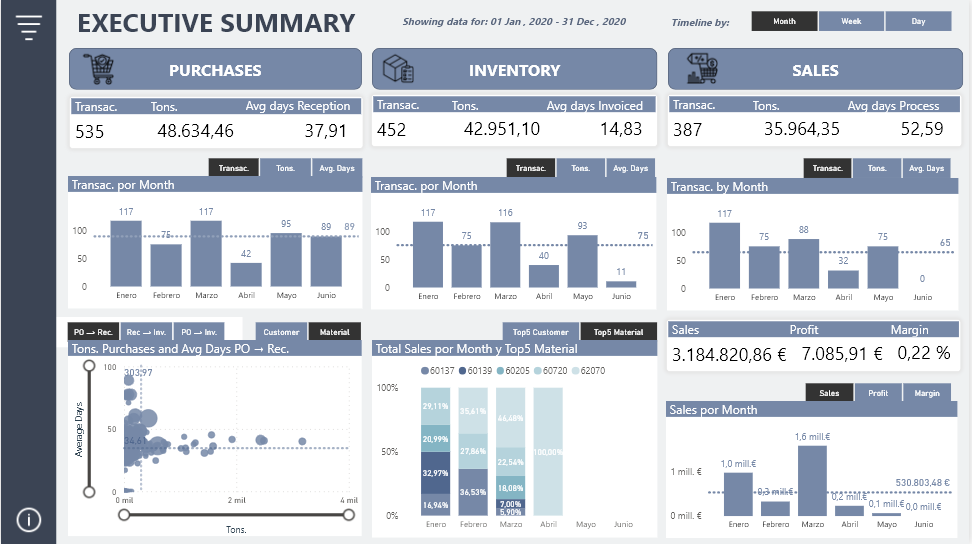
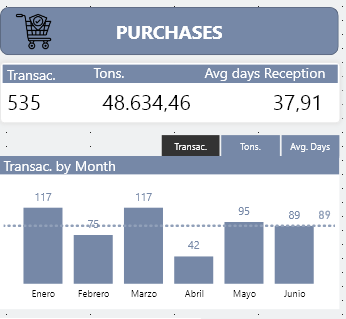
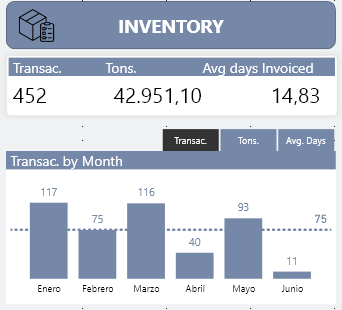
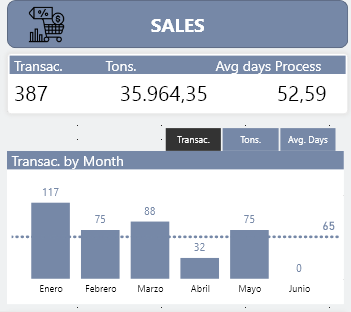
It has been divided into 3 sections: Purchases, Inventory and Sales.
Each of the sections first has a series of cards with the most important measures followed by a bar graph in which to see its trend.
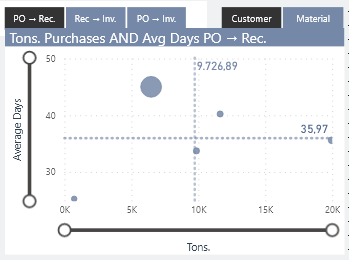
In the lower left part, a scatter graph is shown in which we can see the correlation between the Tons Purchased and the different time intervals between Purchase and Reception, Reception and Invoicing and the complete process.
Below is the Top5 Customer or Top5 Material by time to answer the third question.
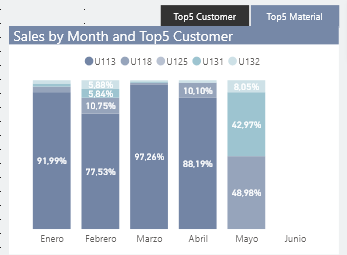
To carry out this, for example, the Top 5 Sales Material has been created in the Materials table the following calculated column that returns the Material code if it is among the 5 best-selling materials:
Top5MaterialSales =
VAR _Rank = RANKX( Dim_Material,
[Total Sales] )
VAR _Result = IF( _Rank <= 5, Dim_Material[Material] )
RETURN _Result
Then we create a measure to filter the blank value on the chart when we select the Top5Material:
Material Filters =
IF(
    MAX( PrmTop5 [PrmTop5] ) =
"Top5 Materials" &&
 MAX( Dim_Material[Top5MaterialSales] ) = BLANK(),
    0,
    1
)
We do the same process for the Customers table and add the two filters to the visual:
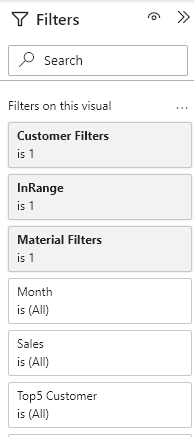
The Main Menu has an image to access the Filters Panel and a button that shows report information as Tooltips.
Regards,
Such a detailed explanation of the development process. Nice job @jafernandezpuga . Really amazing.
Really great work on your report. Looks great and also produces super insights. Nice one
Hi Enterprise DNA Platform Members,
We are proud to announce the winner of the Enterprise DNA Challenge “A Blast from the Past – The Remake of Challenge 7”
The One Week Challenge Winners and Runners up are:
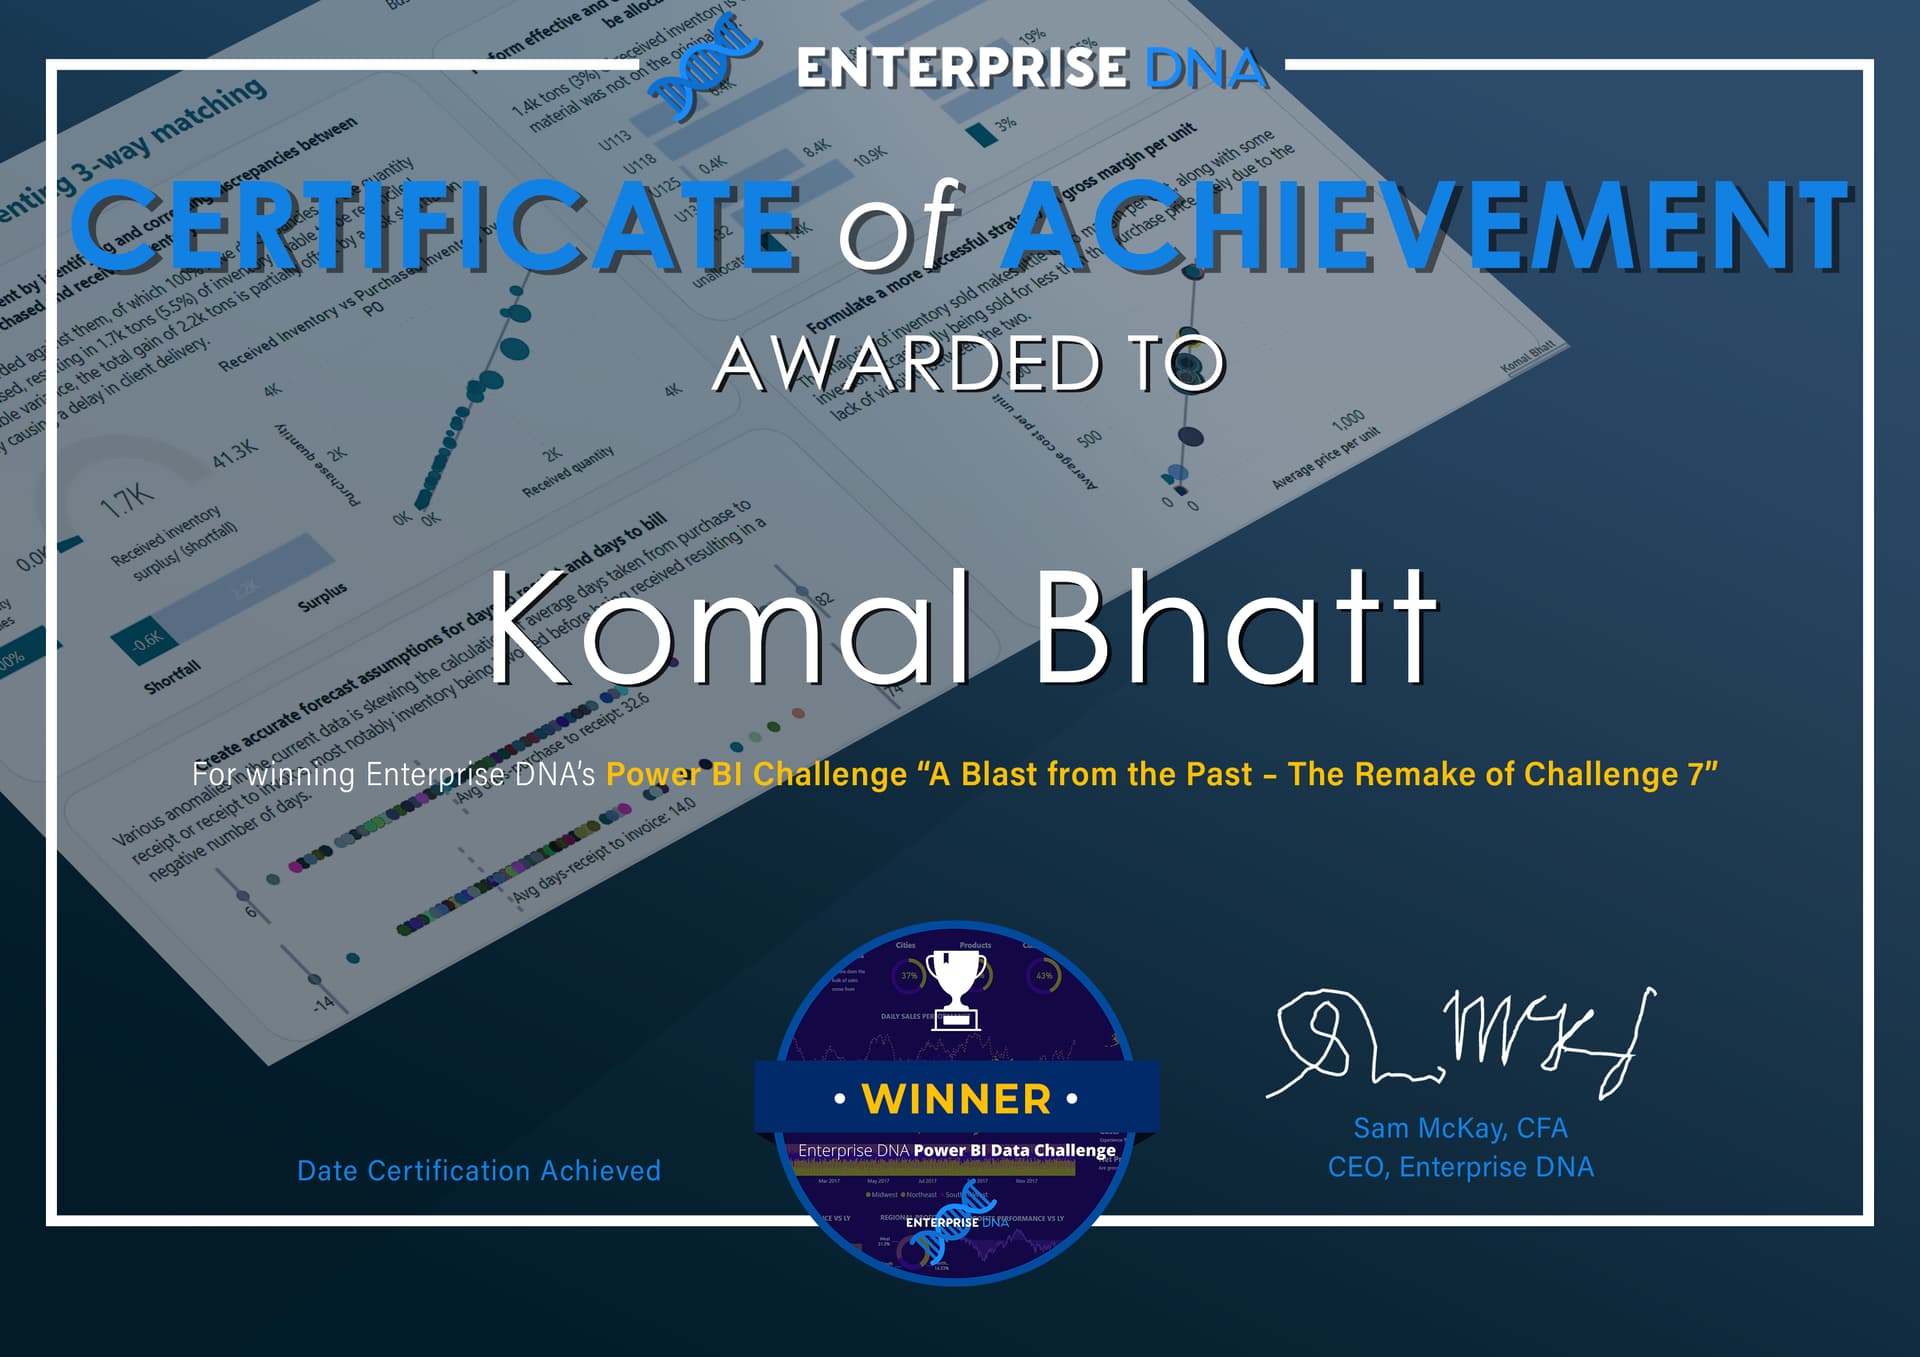
Winner
![]() Komal Bhatt
Komal Bhatt
![]() Challenge Winner badge
Challenge Winner badge
![]() Winner of a free subscription to Enterprise DNA learning Platform
Winner of a free subscription to Enterprise DNA learning Platform
Runner up
![]() Jose Antonio Fernandez Puga
Jose Antonio Fernandez Puga
![]() $50 Amazon Voucher
$50 Amazon Voucher
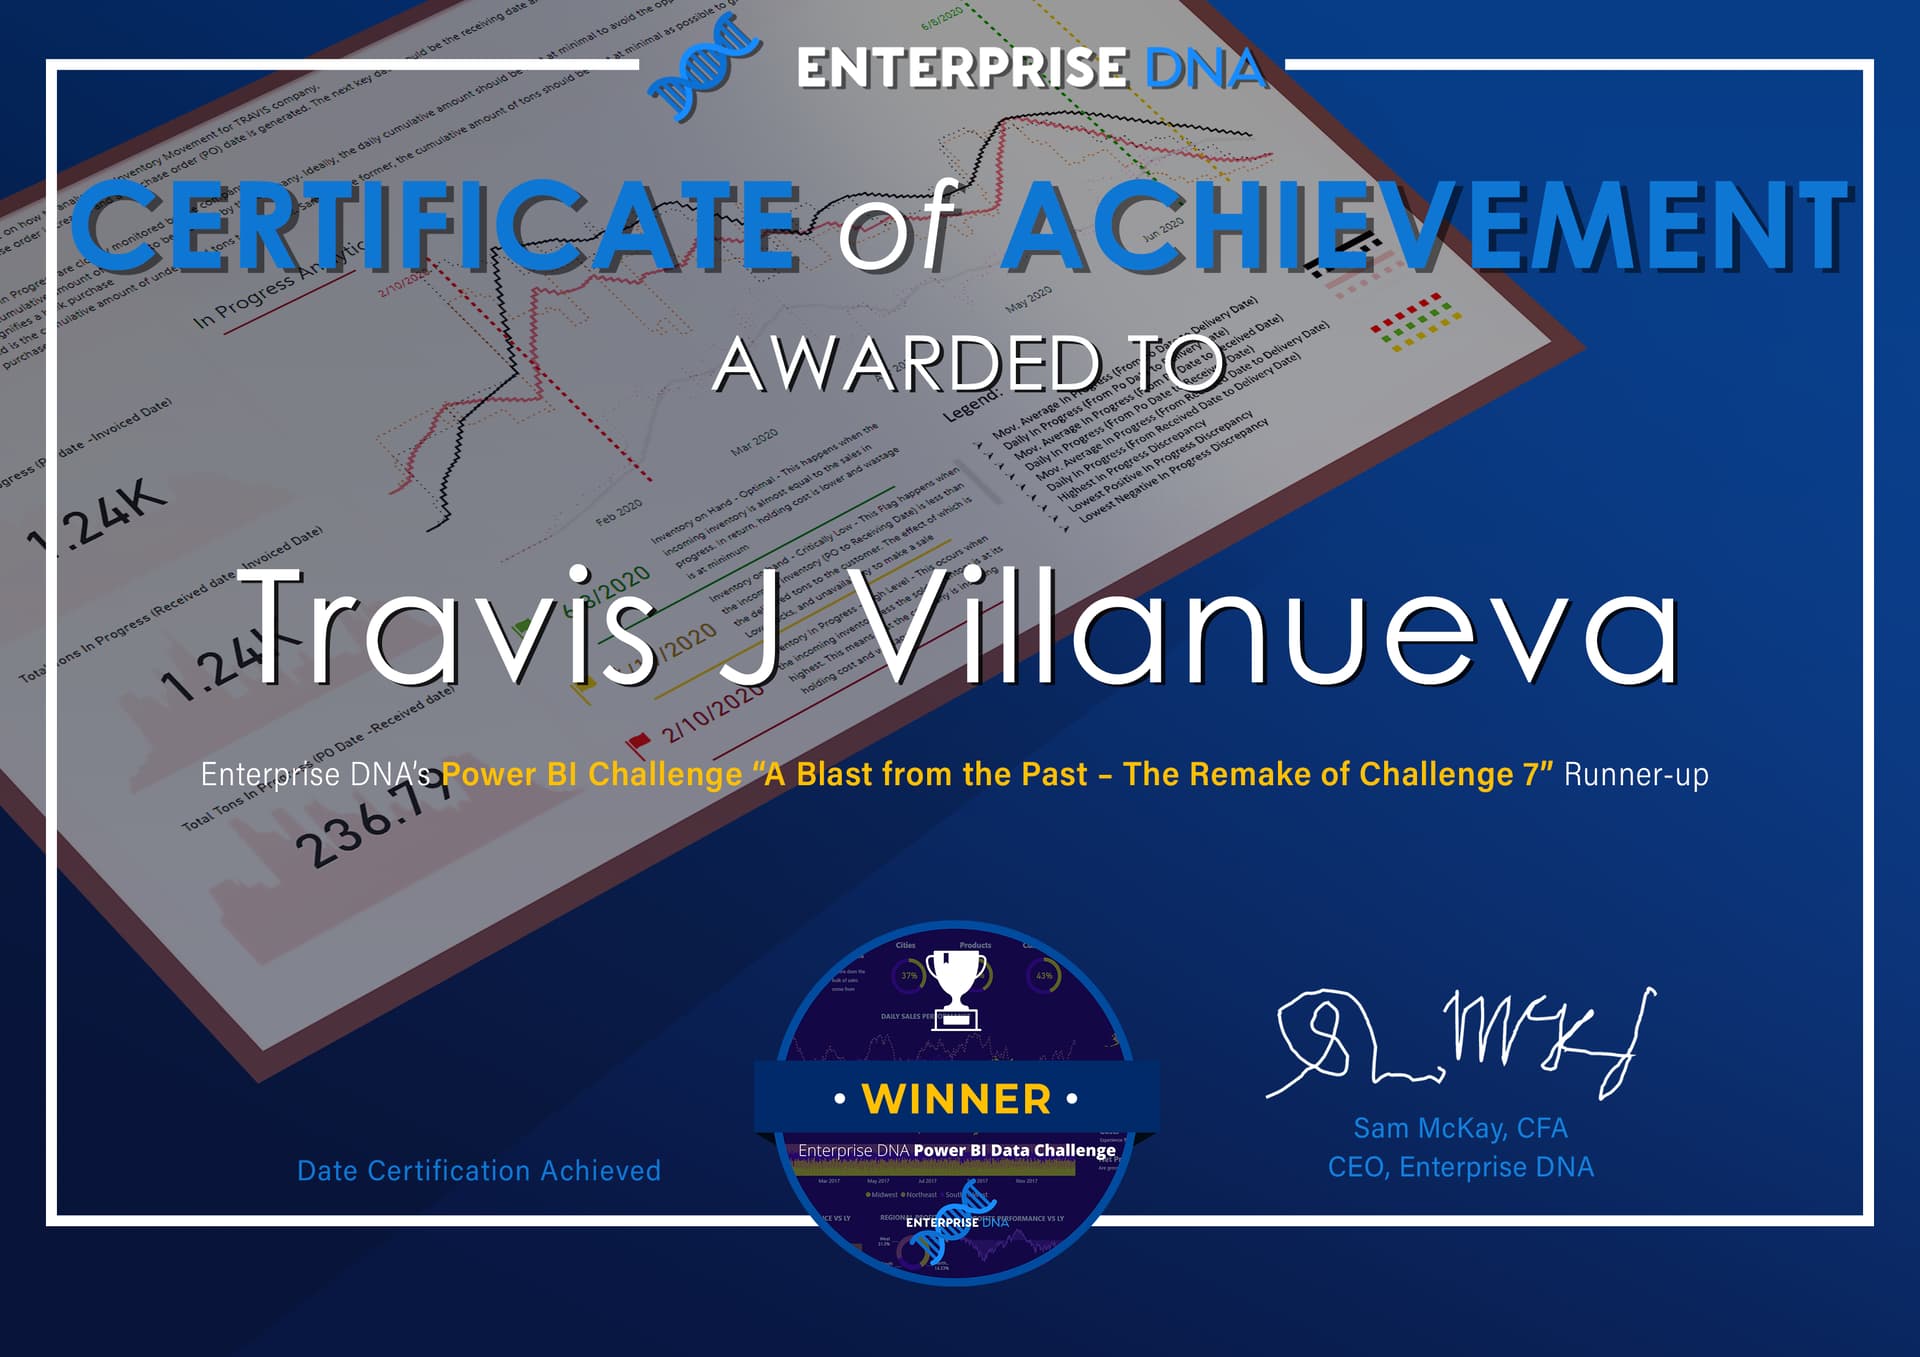
Runner up
![]() Travis J Villanueva
Travis J Villanueva
![]() $50 Amazon Voucher
$50 Amazon Voucher
It has been amazing to see the Enterprise DNA data platform family and Challenges Group members come together and learn on this month’s one week challenge and create stunning and creative reports! To do this in a week and with a difficult dataset it is a great achievement.
Thank you to our judge Mudassir Ali for providing their expertise and time.
Check the recording of the judging panel.

Finally, a big thank you to the Enterprise DNA Challenges Group “Community Lead Team” for their help and support during the “A Blast from the Past – The Remake of Challenge 7” Challenge
The Challenges Team is working hard to bring you Challenge 20. Challenge 20 will be launched in the first week of June, please be alert.
Federico Pastor
Head of Data Challenges
Enterprise DNA
Congratulations to the winners of A Blast from the Past - The Remake of Challenge 7!
Komal Bhatt - Winner
@jafernandezpuga - Runner Up
Travis J Villanueva