After winning the Newcomer Category of Challenge 19, @jafernandezpuga is back for A Blast from the Past - The Remake of Challenge 7 (Remake of Mudassir’s Report). Here’s a snapshot of his work:
Here’s the development process he followed for Remake of Challenge 7
This is the development process I followed for the EDNA Challenge 7 Remake:
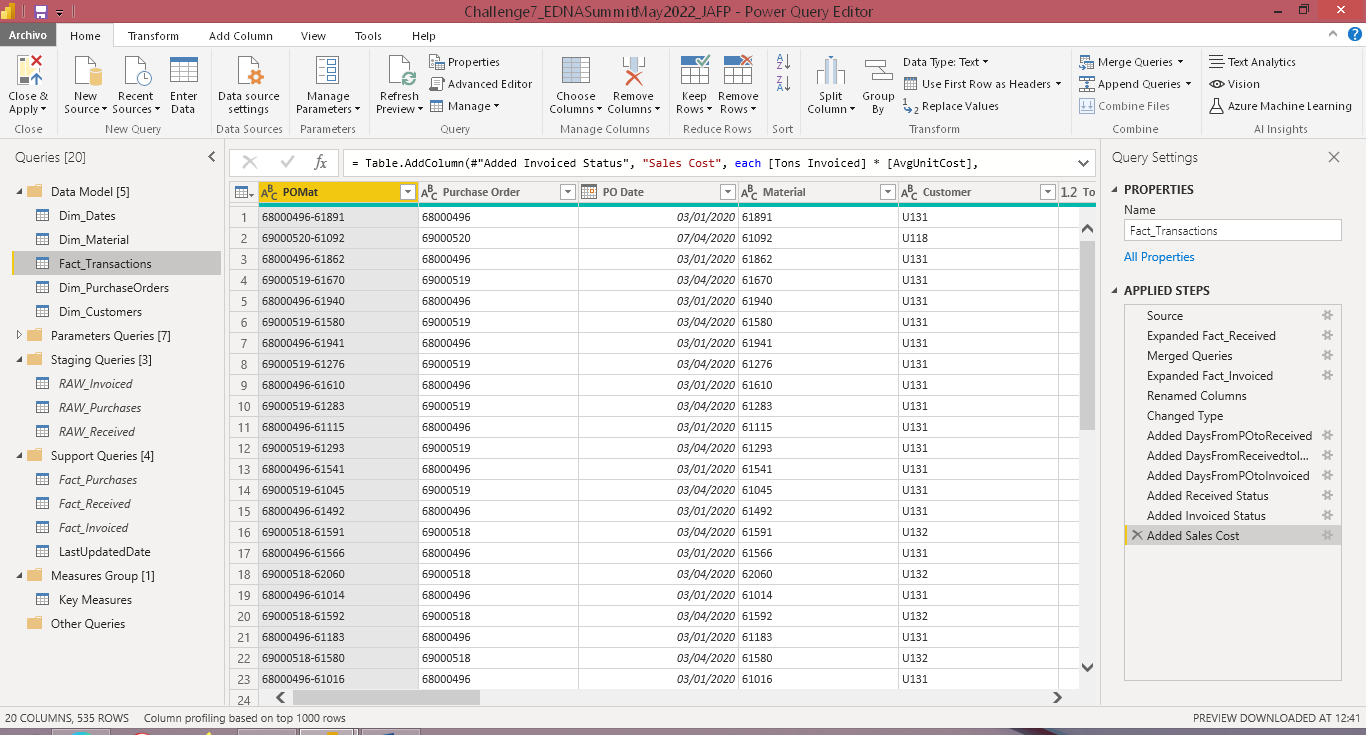
- Loading and cleaning the data from Power Query.
The data for this challenge is made up of 3 fact tables: Purchasing, Receiving, and Billing.
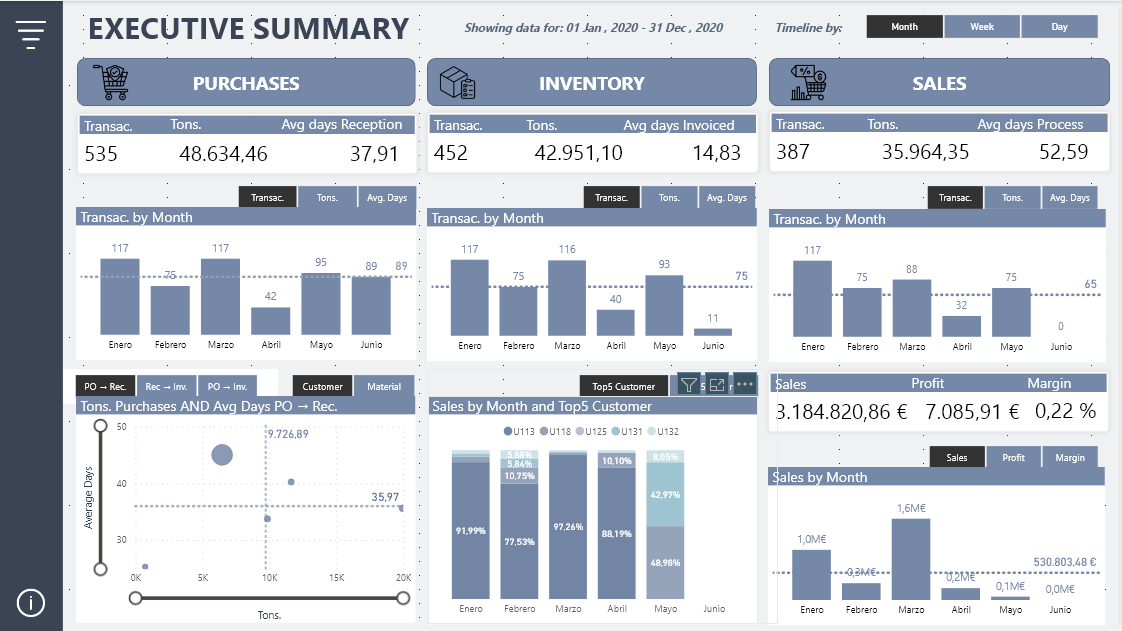
The Purchases table contains information on the date and tons purchased for each Purchase Order, Material and Customer.
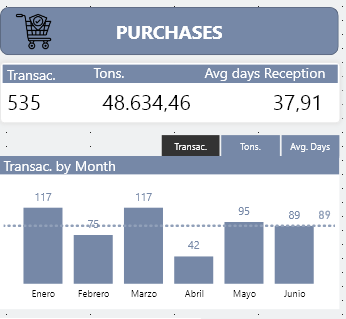
The Receptions table contains the information on the reception date and tons received by Purchase Order and Material.
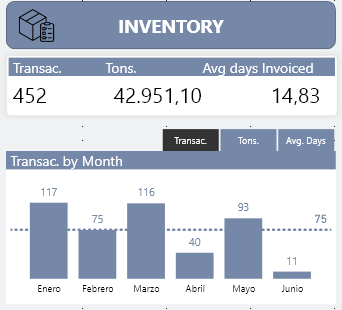
Finally, the Billing table contains the information on the billing date and tons billed by Purchase Order and Material.
In the case of Purchases, each Purchase Order and Material belong to the same Customer, so we can create a primary key by Order and Material and group by this key.
We do the same with the Receiving and Invoicing tables and finally we merge the three tables through the common key to obtain the Fact_Transactions table.
In this way, we limit the analysis to all the transactions of the Purchases table together with those transactions of the other two tables that are related to the latter by Purchase Order and Material.
In the Fact_Transactions table, calculated columns are added with the days from Purchase to Receipt, from Receipt to Invoicing, and the days from Purchase to Invoicing.
As dimension tables we create Dim_Customers, Dim_PurchaseOrders and Dim_Material from the Fact_Transactions table and the Dim_Dates date table is the EDNA date table.• Organization of queries in groups.
- Data Modeling
• I have followed the Star Scheme to model the data and for its graphical representation I have used the cascade design.
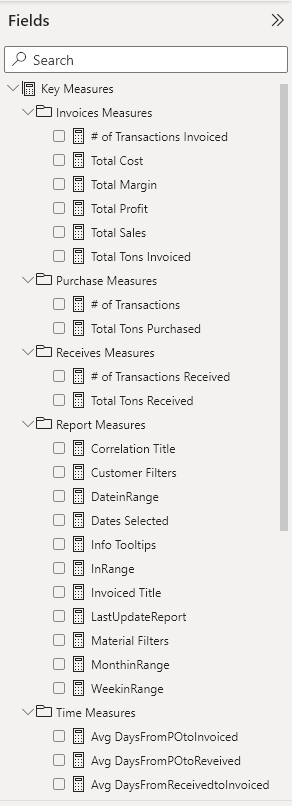
- Creating DAX Measures
• All measures have been organized in folders within the Key Measures table.• The Dax code of all the measures I have formatted using EDNA’s DAX Clean Up.
• UI design.
For the design of the report I have used the iconography of flaticon and I have reused the theme used by @Gustaw in his participation in the EDNA Challenge 19: Call Center Data Reporting.
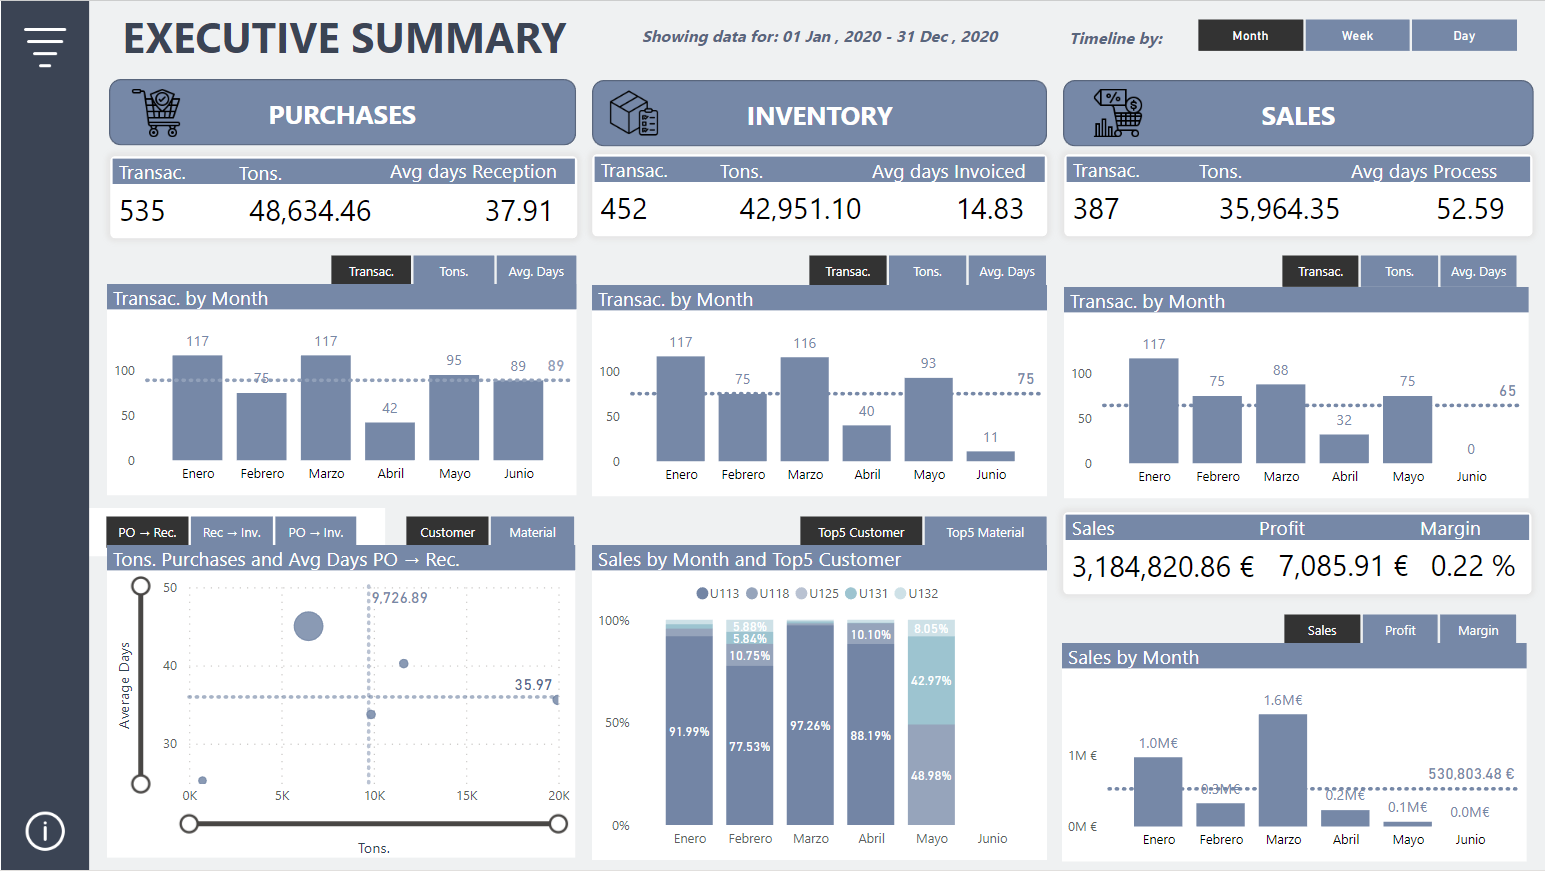
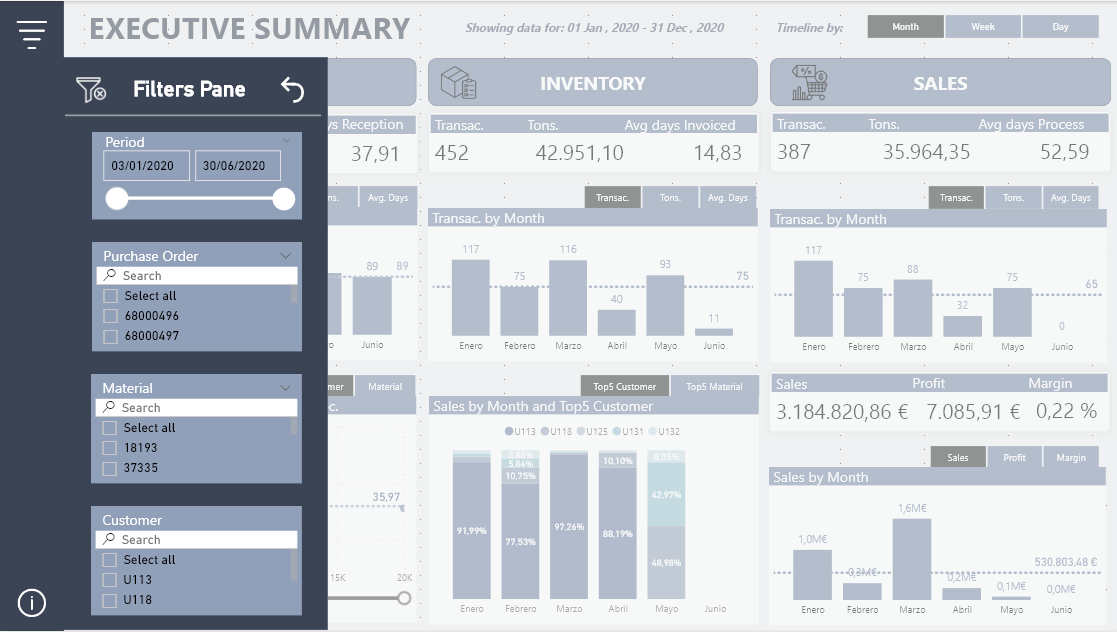
This is a single page report that aims to answer the following questions:
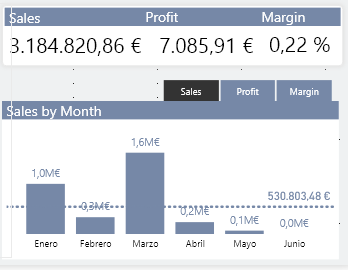
- Monitor the purchasing/receiving/billing trend
- Follow-up of the reception time elapsed by material and client
- Find the best selling materials by time
To make it as dynamic as possible, the field parameters have been used to be able to choose how we are going to display the timeline (Month, Week and Day) and what measure we are going to monitor.
It has been divided into 3 sections: Purchases, Inventory and Sales.
Each of the sections first has a series of cards with the most important measures followed by a bar graph in which to see its trend.
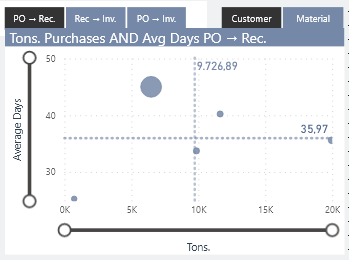
In the lower left part, a scatter graph is shown in which we can see the correlation between the Tons Purchased and the different time intervals between Purchase and Reception, Reception and Invoicing and the complete process.
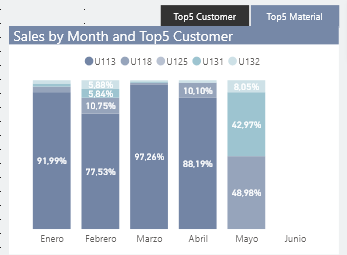
Below is the Top5 Customer or Top5 Material by time to answer the third question.
To carry out this, for example, the Top 5 Sales Material has been created in the Materials table the following calculated column that returns the Material code if it is among the 5 best-selling materials:
Top5MaterialSales =
VAR _Rank = RANKX( Dim_Material,
[Total Sales] )
VAR _Result = IF( _Rank <= 5, Dim_Material[Material] )
RETURN _Result
Then we create a measure to filter the blank value on the chart when we select the Top5Material:
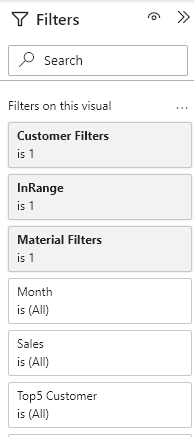
Material Filters =
IF(
    MAX( PrmTop5 [PrmTop5] ) =
"Top5 Materials" &&
 MAX( Dim_Material[Top5MaterialSales] ) = BLANK(),
    0,
    1
)
We do the same process for the Customers table and add the two filters to the visual:
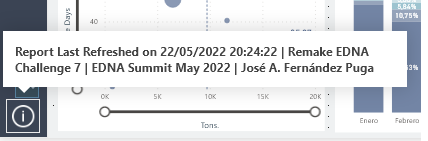
The Main Menu has an image to access the Filters Panel and a button that shows report information as Tooltips.


Here’s the link to the report:
Microsoft Power BI
To learn about the real-life scenario presented for the challenge, be sure to click on the image below.