60 Day Running Totals with Non Contigous Dates

Hi All,

My ultimate objective is to calculate a 60 day running average and as a first step I am trying to calculate a 60 day running total. But there is a twist. I have data ( fitness data including steps and calories) over 2 years, however, some dates have no data and some others have inconsequential data, both of which I wish to exclude. If you like, an analogy might be a business that generates sales 5 days a week and not at weekends.

In the data table, I have added a column which marks whether the date is useful(1) or not (0). I have created measures called Active Steps and Active Calories, by modifying the base aggregation measures that count only the steps and calories for the useful days.

Using the measure below, I have created another table(called Steps Days) which only includes the useful dates.

Steps Days = 
FILTER(
SUMMARIZE(
    Data,
    'Calendar'[Date],
    Data[Steps],
    Data[Active Days]
    ),
    Data[Active Days] = 1)

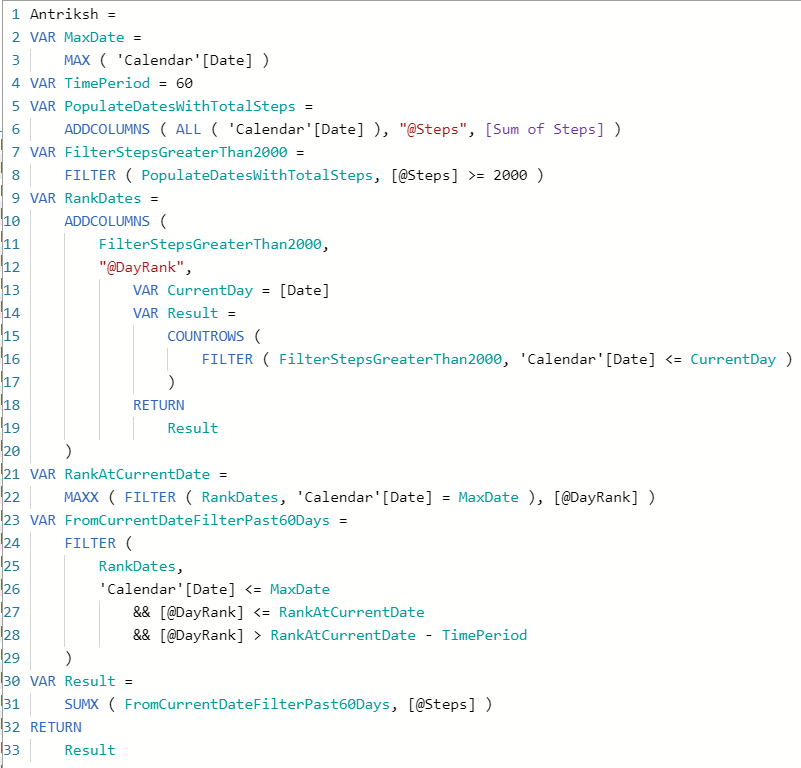
Using this, I created a measure to calculate the 60 day running total for steps, but I ended up with rubbish.

60 Day Running Total test =
CALCULATE([Active Steps],
DATESINPERIOD(‘Calendar’[Date],
MAX(‘Steps Days’[Date]),
-60,
DAY))

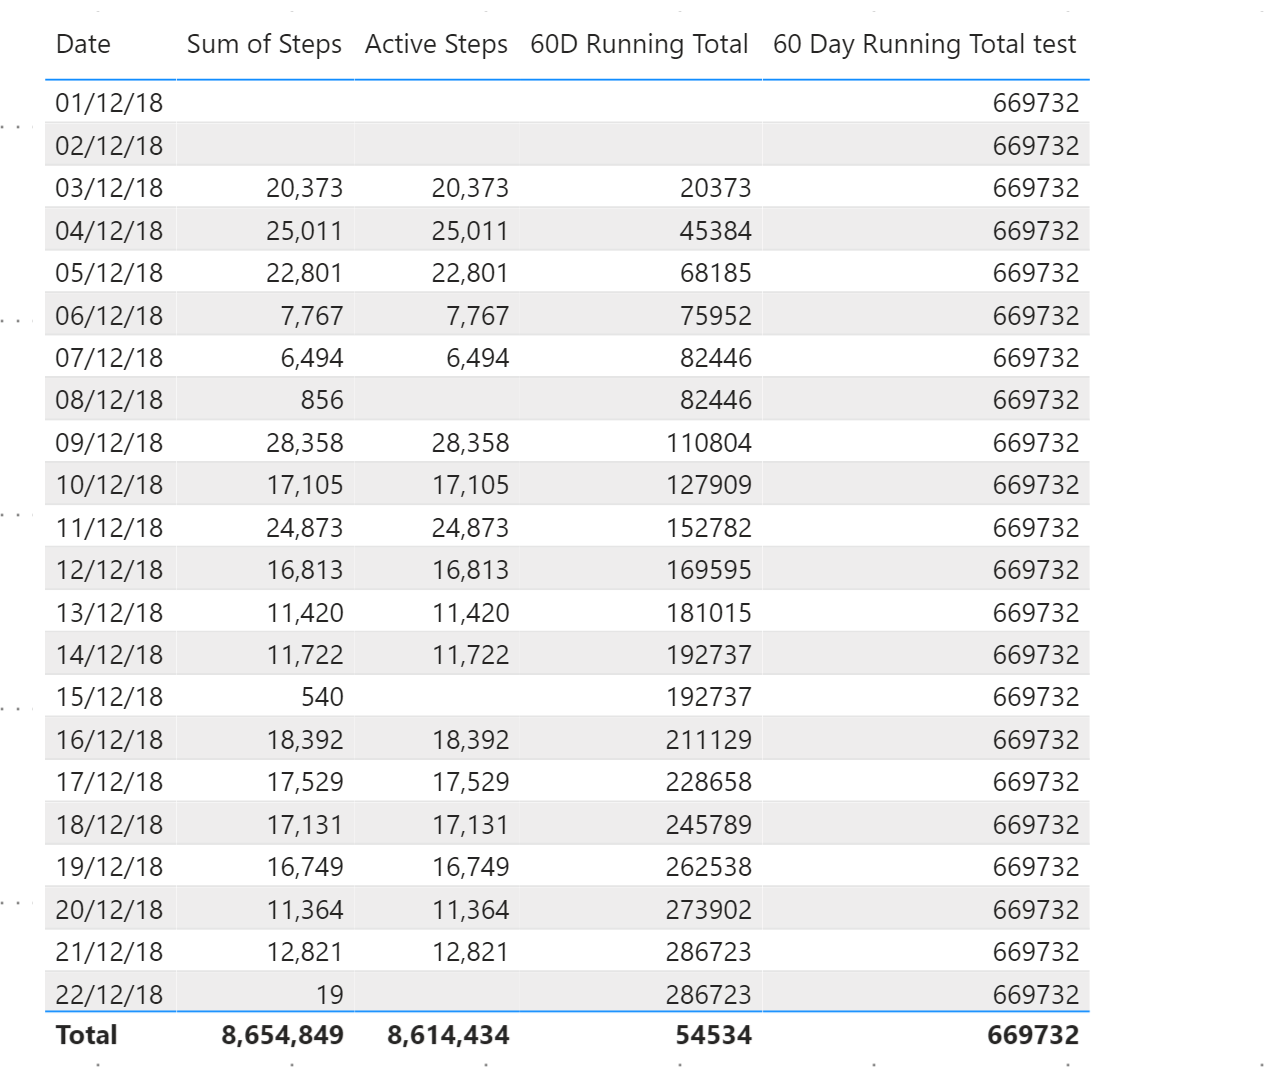
This screen shot shows the results and what I am working with. The 60D running total is working as it should over the Active Steps Measure, which excludes days with less than 2,000 steps, by adding 60 consecutive days regardless of whether or not any date has useful data. What I am trying to calculate in the 60 Day Running Total Test measure, however, is 60 consecutive useful days of data (Active steps).

Thank you for your assistance in this problem.

The file is attached.

Fitbit.pbix (120.7 KB)

Michael Gordon

@MIchaelGordon Everything before the comma is clear to me but after that I am not able to understand the requirement, can you please explain in more detail?

Sorry, if not entirely clear.

I am trying to calculate a running total on 60 consecutive days of useful data, ie ignoring those days with non-useful data.

I hope that is better.

Thanks Michael Gordon

Hi
I have one solution which you can try.
at first try to create a variable and in that variable filter all non useful days.
then use that variable in your further calculation of running total of 60 consecutive useful days.
I hope it will work.
Best of luck.

@MIchaelGordon See if this works, I checked in the Excel and it gives total of 60 days at each cell in the visual:

Fitbit.pbix (130.7 KB)
data.xlsx (52.8 KB)

Antriksh = 
VAR MaxDate =
    MAX ( 'Calendar'[Date] )
VAR TimePeriod = 60
VAR PopulateDatesWithTotalSteps =
    ADDCOLUMNS ( ALL ( 'Calendar'[Date] ), "@Steps", [Sum of Steps] )
VAR FilterStepsGreaterThan2000 =
    FILTER ( PopulateDatesWithTotalSteps, [@Steps] >= 2000 )
VAR RankDates =
    ADDCOLUMNS (
        FilterStepsGreaterThan2000,
        "@DayRank",
            VAR CurrentDay = [Date]
            VAR Result =
                COUNTROWS (
                    FILTER ( FilterStepsGreaterThan2000, 'Calendar'[Date] <= CurrentDay )
                )
            RETURN
                Result
    )
VAR RankAtCurrentDate =
    MAXX ( FILTER ( RankDates, 'Calendar'[Date] = MaxDate ), [@DayRank] )
VAR FromCurrentDateFilterPast60Days =
    FILTER (
        RankDates,
        'Calendar'[Date] <= MaxDate
            && [@DayRank] <= RankAtCurrentDate
            && [@DayRank] > RankAtCurrentDate - TimePeriod
    )
VAR Result =
    SUMX ( FromCurrentDateFilterPast60Days, [@Steps] )
RETURN
    Result

6 Likes

@AntrikshSharma,

Really nice solution here. But it made me wonder - did you look at this problem and think “okay this is going to take some work, so let’s not spend ANY brainpower naming the measure”? :rofl:

  • Brian
2 Likes

@BrianJ Hahaha, you are absolutely right, I initially named variables T, N, G, P, F. Naming variables/measures takes up so much creativity and time and I don’t want to lose track of all those virtual tables/calculation we have to do in our minds. lol!

2 Likes

I had the same first thoughts as you, so I’m happy it worked.

As for variable naming, I’m not creative either so I am just very verbose and use an entire phrase in CamelCase, like “_CurrentMonthSelectedInSlicer” or whatever. Given the Intellisense in the DAX Editor window, I only need to write it once.

Greg

2 Likes

Hi Antriksh

Thank you very much for your solution. I have tested it and it works.

But I am a struggling newbie and having spent some time looking at the measure, I don’t understand how it works.

I understand what most of the variables are doing, in isolation. What I don’t undertand is what the RankDates variable is doing and how all the bits come together.

Could you please explain your thinking and how it works. This would be greatly appreciated.

Again, thank you very much

Michael Gordon

1 Like

@MIchaelGordon The problem with going back 60 days based on the current date is you would end up at calendar based 60th day, but we want to remove the days that do not match the criteria so it doesn’t makes any sense to traverse back based on calendar, so what is the next best alternative? we have dates! and dates are nothing just a serial number in DAX since 12/30/1899, so we can rank them! and you know we have already filtered Steps so if I go back 60 Ranks back from Today(11/08/2020) I am not going back to September, 08, 2020, I will be at a day that is prior to that depending on where Current Rank - 60 lands us.

You can also see the results yourself by copying the code in a calculated table:

Look at the date at 60th Rank in the below image, if you subtract 60 from 02/11/2019 you would go back to 12/13/2018 which is 60 days based on calendar and not on the rows of our filtered data, and when you go back on the basis of rank you get to 12/03/2018 as required.

3 Likes

Antriksh,

Thank you for your explanation. I can follow the general thrust but have some way to go to follow what’s happening line by line. What you have done will be a great learning piece which I can refer back to to as my experience builds.

Just one other question. Why did you complete the whole expression in two stages (with return twice) rather than with one Return.

I appreciate your help and consideration. A problem I have, and I assume as do many others, is that whilst authors ( I am reading many books including Russo and Ferrari) and Online instructors are very good with the what and how of a DAX expression, the Why tends to be lacking.

Whilst basic expressions are easy to grasp, I find it difficult to understand the processes of more complex expressions and appreciate the explanation of the logic and thought processes behind what the expresssion is seeking to achieve.

Thank you again.

Michael Gordon

First Return statement is Local to the RankDates variable, the Result part of RankDates isn’t available to following statements after “)”, wrote the code like that for readability purpose.

You will get there with practice and time, DAX is one of its own kind so a steep learning curve is expected for everyone. Good Luck.

Hi @MIchaelGordon, a response on this post has been tagged as “Solution”. If you have a follow question or concern related to this topic, please remove the Solution tag first by clicking the three dots beside Reply and then untick the check box. Also, we’ve recently launched the Enterprise DNA Forum User Experience Survey, please feel free to answer it and give your insights on how we can further improve the Support forum. Thanks!

@MIchaelGordon If you are still interested in a more detailed explanation then I have created this blog that you can read:

Also, a really good question! Thanks.

4 Likes

Hi Antriksh,

Thank you, I have now read your commentary twice and it is starting to sink in. There is an enormous anount to absorb in the RankDates variable and I expect it will take a few more readings to fully understand what is happening.

I get the overall strategy, but the process is challenging to absorb. Thanks again.

Good Luck with the blog.

Cheers
Michael Gordon

1 Like

Using the below version I was able to cut down query time to half.

using SELECTEDVALUE instead of MAX helped in reducing 1 full Storage Engine query. MAX was materializing all the dates. Also, It makes sense to use SELECTEDVALUE as in this case a sub/grand total at month/quarter/year level ( only applicable in case of a Matrix visual and not Table visual ) of a running total doesn’t add any real business value ( SELECTEDVALUE returns blank if there are more than 1 value visible in the current filter context for the column specified in it).

Running Total = 
VAR MaxDate =
    SELECTEDVALUE ( 'Calendar'[Date] )
VAR TimePeriod = 60
VAR FilterStepsGreaterThan2000 =
    CALCULATETABLE (
        SUMMARIZE ( Data, Data[Steps], Data[Date] ),
        Data[Steps] >= 2000,
        ALL ( Data )
    )
VAR RankDates =
    ADDCOLUMNS (
        FilterStepsGreaterThan2000,
        "@DayRank", RANKX ( FilterStepsGreaterThan2000, Data[Date], Data[Date], ASC )
    )
VAR RankAtCurrentDate =
    MAXX ( FILTER ( RankDates, Data[Date] = MaxDate ), [@DayRank] )
VAR FromCurrentDateFilterPast60Days =
    FILTER (
        RankDates,
        [@DayRank] <= RankAtCurrentDate
            && [@DayRank] > RankAtCurrentDate - TimePeriod
    )
VAR Result =
    SUMX ( FromCurrentDateFilterPast60Days, [Steps] )
RETURN
    Result

RANKX turns out to be extremely efficient. It literally cuts down Physical query plan steps in half and on a large model it reduced total time by a lot.

Physical & Logical plan of solution with RANKX :

Physical & Logical plan of solution with COUNTROWS ( FILTER () )

3 Likes

@AntrikshSharma,

Really interesting. When you look at the physical and logical plans, are you looking only at the length or are there other substantive elements of those plans you look at?

  • Brian

@BrianJ As of now I am only looking at # Line numbers, I have read some articles from Jeffery Wang so I have faint idea of what some of those operators such as ScaLogOp/RelLogOp are doing.

Even a small measure can create a plan with way too many lines, so reading these in depth isn’t a productive thing to do, at most I would check the parent and some children to understand who calls whom, most of the time XMSQL will offer a great deal of information, I was able to realize MAX is not a good function to use here based on XMSQL query, and will pay attention how it behaves going forward.

Key point here was knowing many ways of writing same thing because after all XMSQL was same in most of the cases so some times it isn’t useful at all and the question you have is what do I do next or how to do it differently?

After spending 3-4 hours CALCULATETABLE & SUMMARIZE construct clicked, and I must have written 500 lines easily. The reason why it is efficient is because ADDCOLUMNS ( ALL ( Dates ), “Steps”, [Total Steps] ) leads to a JOIN operator in XMSQL which will slow down the code as you have to pay a price for joins.

The reason why RANKX is efficient lies somewhere in Logical plan/Physical Plan which I might try to decode sometime later.

3 Likes