While I think this is a really fun collaborative effort, with a lot of analytically interesting questions that serve as a great way for us to sharpen our Power BI skills, personally I don’t think this is a sound investment strategy. While there aren’t a lot of data points, the performance of funds based on this approach is pretty dismal. Furthermore, if you believe free markets operate according to rational expectations, and particularly as technology has made this sort of analysis available to individual investors, then the forecasts based on technical analysis will already be factored into the market price. I think the chance of this sort of analysis outperforming a low fee, total market index over any significant length of time is nearly nil.
Other certainly may, and probably will, disagree with this assessment, but I just wanted to clarify that my strong enthusiasm for this project is strictly from a learning standpoint and not an endorsement of the strategy itself.
Correct Brian. Intrigues me aswell the possibilities of PBI and I enjoy learning from you guys and seeing all of us come together on a project.
Like I said before its not my full time occupation just merely sharing my experience on what has worked well for me in the past.
I agree with what you said before I don’t have the same skills as you in PBI so better you modify and post pbix updates only here and we just bounce ideas off each other.
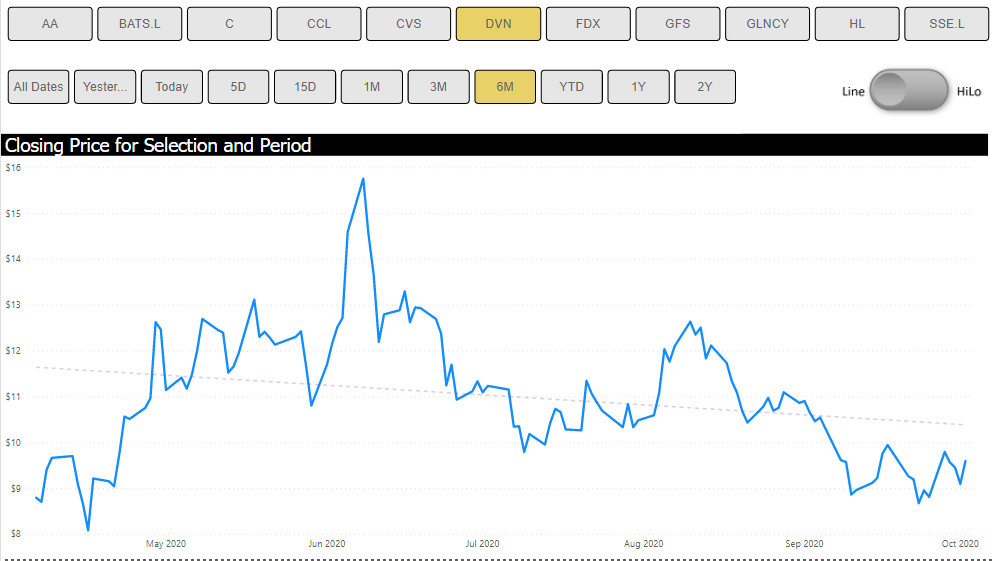
@JarrettM and I have got the period slicer and the dynamic two-year pull working like a champ. I haven’t had time to implement the chart type switcher, but that will be easy and I can do it tonight.
Looks fantastic Brian great stuff. Think the best way is to try and start adding the tools to the chart step by step.
The process of analysing charts i like to use is as follows.
Step 1. Main chart behaviour
is it trending up or down
oscillating (bouncing up and down)
Step 2. Trend lines
current major trend lines
previous major trend lines
current minor trend lines
Step 3. Support and resistance lines
channelling lines
long term resistance lines
short term resistance lines
Step 4. Chart patterns
reversal patterns there are 10 of these
continuation patterns there are 6 of these
Step 5. Indicators
-trending indicators, moving averages need simple ones and exponential moving averages. MACD, RSI, CCI, , Volume
oscillating - Stochastics
There’s alot to take on here id suggest let’s start putting in some basic indicators then build up to the more complex things. I think you done volume already so can we start with moving averages?
Short, medium and longterm exponential 10MA, 20MA,
Thanks – that’s a good summary of where we ultimately need to go with this. Can I suggest instead that you take the first run at this, getting as far down the list as you can, and then just give a shout if and when you get stuck?
But how can we make this dynamic… so that I could get yesterday’s share price or last weeks without having to change the date range manually and then pasting the url into the function QuotePull?
There at least are a couple of ways you could do this. You could parameterize the timeframe and then pull that into the API on refresh, but the much simpler way to do it unless you’re pulling a huge number of stocks at the same time is to pull the maximum time period by default (2 years in this case), and then filter down to the data you want using a period slicer, as @JarrettM and I did below and in post #42 above. In that post we also included the PBIX file if you want to see exactly how Jarrett added the period slicer to the earlier model.
But how can we make this dynamic… so that I could get yesterday’s share price or last weeks without having to change the date range manually and then pasting the url into the function QuotePull? I know you’ll kn
Hi… yes I’m fine and hope you are too. We’re out of lock down in Israel… so that’s a great feeling. Actually, what I needed was just a list of yesterday’s prices. I download every month 3 years worth of stock prices and dividends for 200 odd tickers and that generates the graphs. I use that using an Excel routine by ExcelNet… it’s excellent. That generates the .csv files that I pull in … they go into a query to produce the prices and dividends tables.
But what I wanted, in addition, was a dynamic update of yesterday’s or today’s prices and actually, I am now doing that using Excel’s stock data. I upload that and manipulate a bit via Power Query to convert different currencies to USD and then I both last month’s and the latest prices to do a comparison. It all seems to work quite nicely but you set me on the right course which I NEVER would have done without reading your piece with your marvellous step by step explanations. I’m definitely getting better at all this stuff but still feel so far behind… with so much more to learn (and worrying if my brain is up to it)!!
First of all, I am a fan of this project. I started my own myself, but I came across several problems of which I solved a few already. I just can’t happen to find the right solution on the internet to help me further. I added my file in the attachment.
As a trader myself, I want to build a dashboard that will calculate a stoploss and profit target for trades based on the last (daily) close price and (monthly) standarddeviation. The problem is, however, that I am not able to return individual latest date stock/forex prices with what I tried so far (for example LOOKUPVALUE).
Is there any way you could help me find the solution? Beneath here is a summary of some calculations I do in Excel (I just want a strong, Power BI visual dashboard for this):
Long trades:
Stoploss = previous daily close * (1-monthly stdev)
Profit target = previous daily close * (1+3*monthly stdev)
Short trades:
Stoploss = previous daily close * (1+monthly stdev)
Profit target = previous daily close * (1-3*monthly stdev)
Say a stock closed yesterday at a price of 100 dollars with a monthly stdev of 5%, I want PBI to return the following with cards:
Long trades:
You might want to start a new topic as this posting is already solved. Members of the forum might not see your message as they don’t view solved posting. It will delay in answering your question.
You will get better results if you start a new posting. (its best practice within the forum.
thanks
Keith
I’m so sorry. I’m still new to using this forum and didn’t want to spam new topics as I have started two already in a short period of time. I will start a new one. Thanks for pointing this out to me!