Hi @Greg
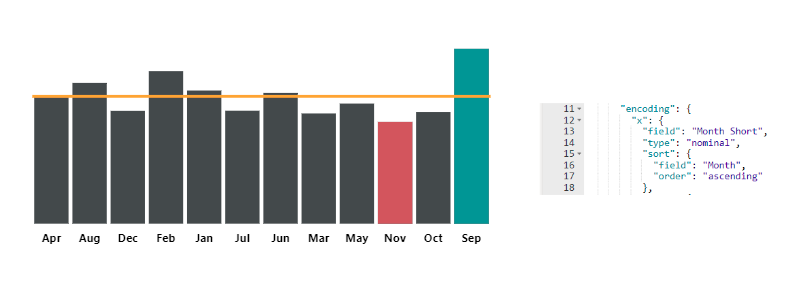
I am trying to sort the x-axis “Month short” ascending by “Month”. However, it doesn’t work specifically after adding max and min column marks.
Daniel
Deneb X-axis sorting issue…pbix (5.0 MB)
Hi @Greg
I am trying to sort the x-axis “Month short” ascending by “Month”. However, it doesn’t work specifically after adding max and min column marks.
Daniel
Calling-out a specific forum member (or members) is discouraged. It may delay or prevent a response as many forum members will disregard such posts. Nevertheless, here’s what I came up with.
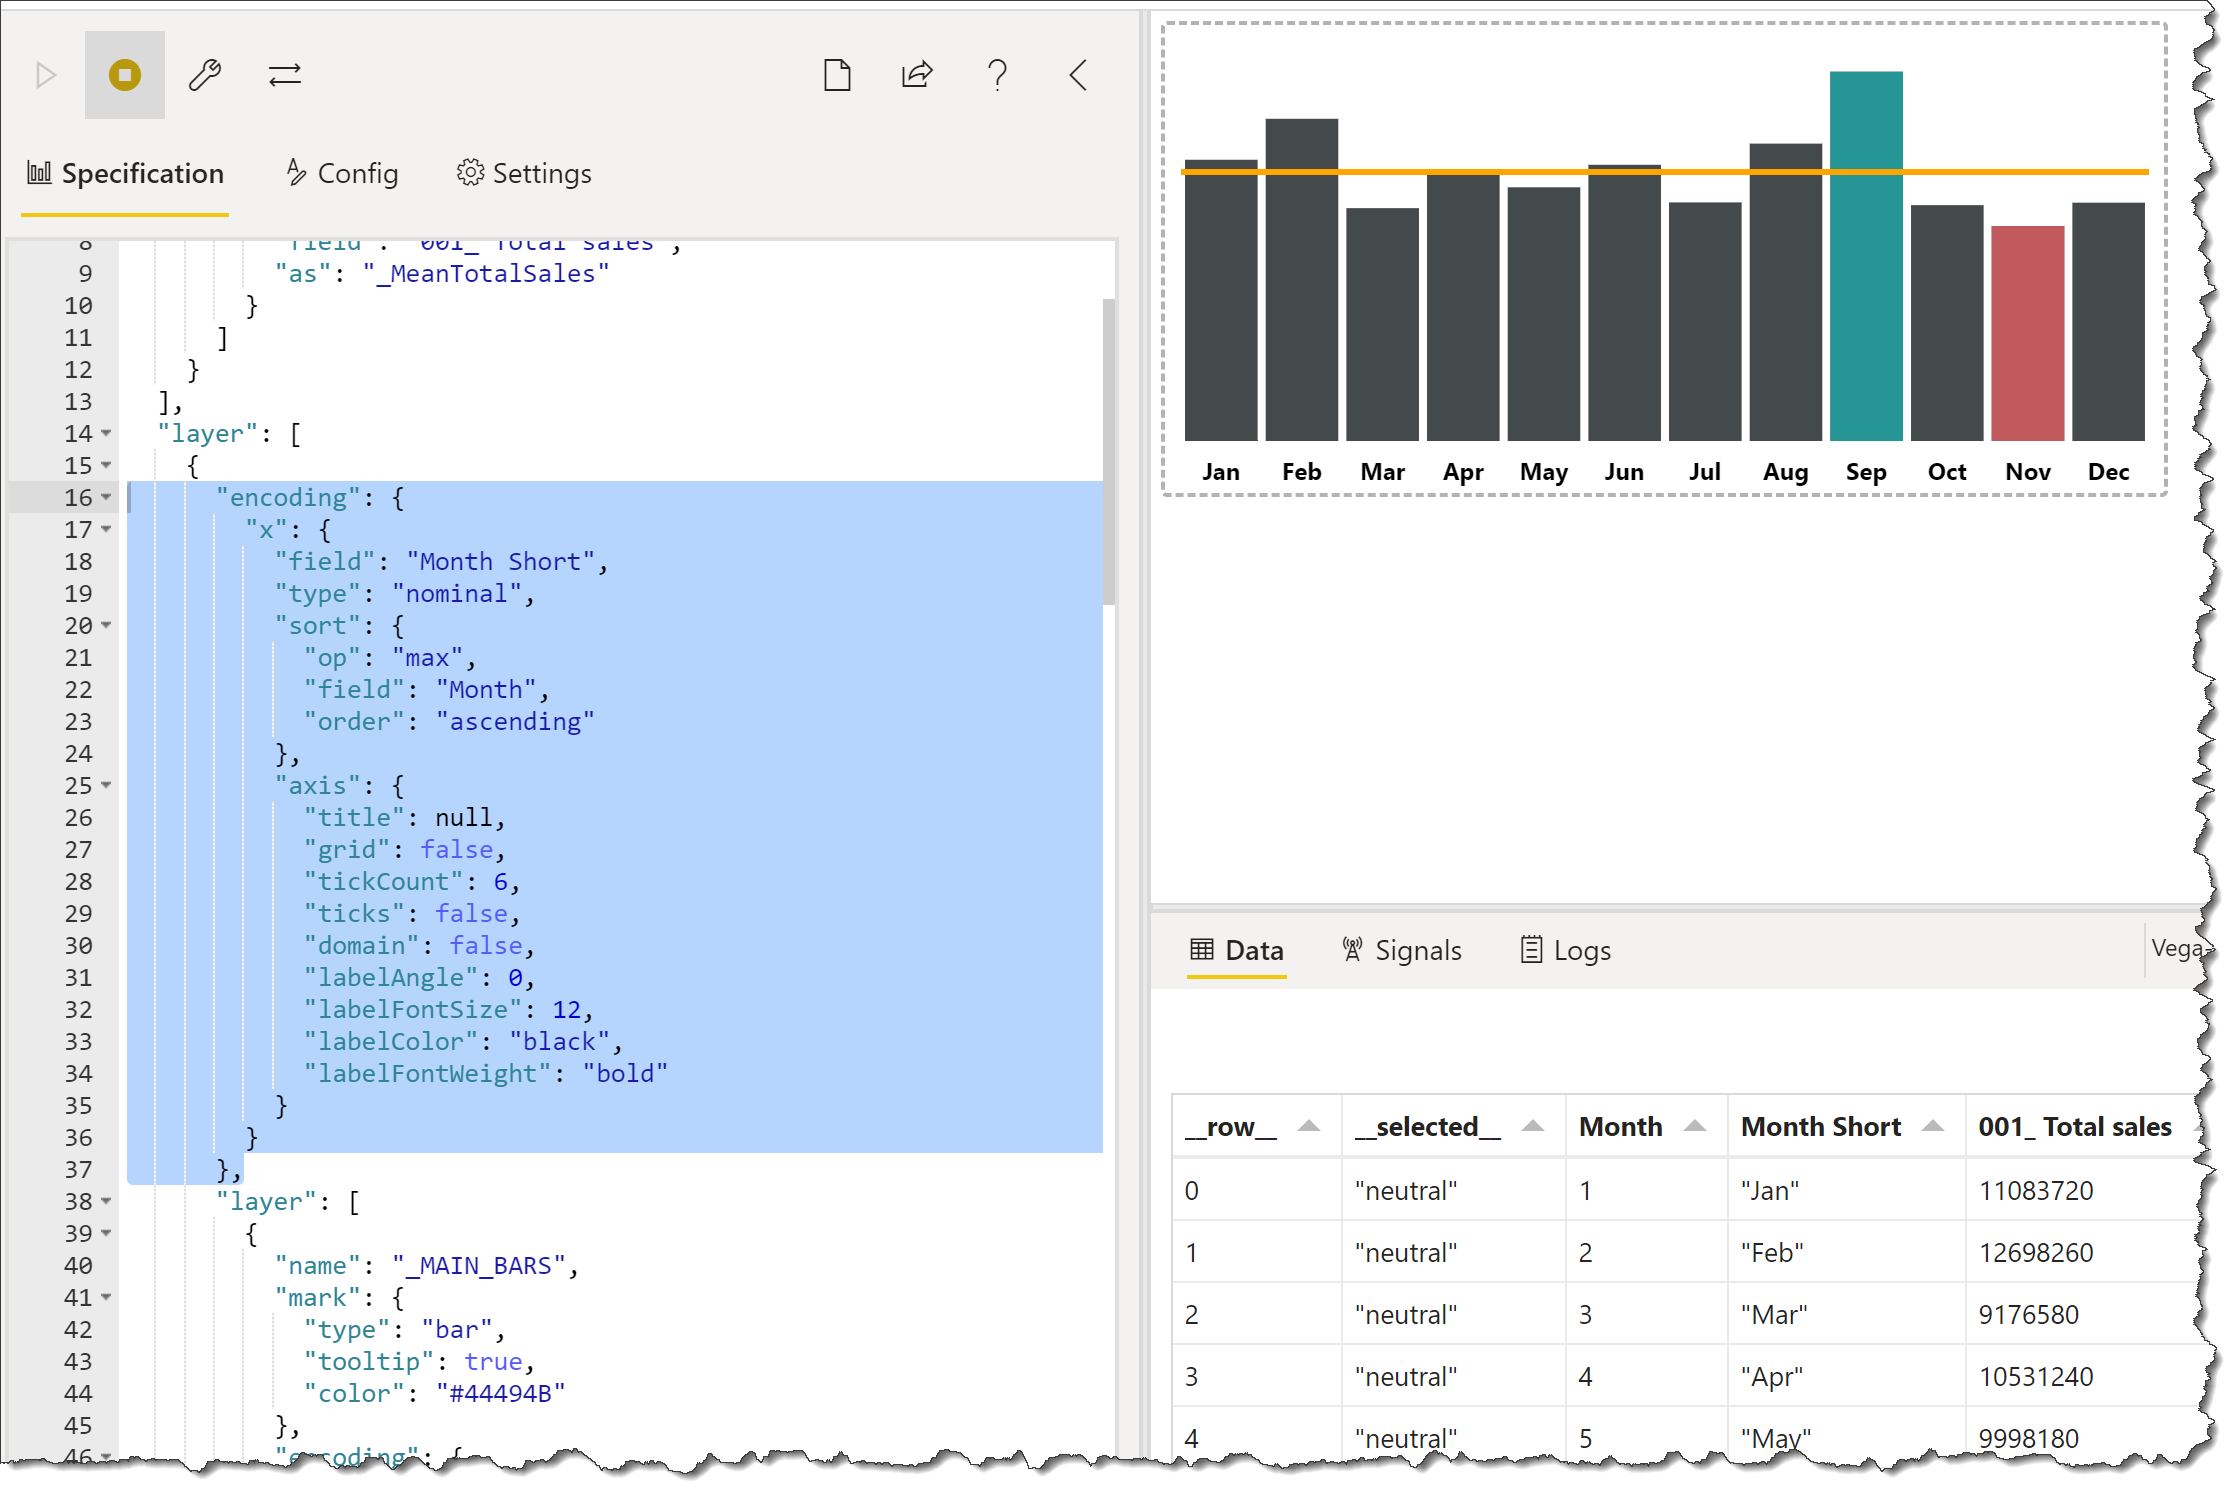
To resolve your sorting issue, move the X encoding into a shared encoding block outside the layer block, and use a max-month-ascending sort block. This fixes the bars, but messes-up the rule (as it now had x encoding), so I added a dedicated joinaggregate transform to calculate the mean and added a nested layer block.
{
  "data": {"name": "dataset"},
  "transform": [
    {
      "joinaggregate": [
        {
          "op": "mean",
          "field": "001_ Total sales",
          "as": "_MeanTotalSales"
        }
      ]
    }
  ],
  "layer": [
    {
      "encoding": {
        "x": {
          "field": "Month Short",
          "type": "nominal",
          "sort": {
            "op": "max",
            "field": "Month",
            "order": "ascending"
          },
          "axis": {
            "title": null,
            "grid": false,
            "tickCount": 6,
            "ticks": false,
            "domain": false,
            "labelAngle": 0,
            "labelFontSize": 12,
            "labelColor": "black",
            "labelFontWeight": "bold"
          }
        }
      },
      "layer": [
        {
          "name": "_MAIN_BARS",
          "mark": {
            "type": "bar",
            "tooltip": true,
            "color": "#44494B"
          },
          "encoding": {
            "y": {
              "field": "001_ Total sales",
              "type": "quantitative",
              "scale": {"zero": false},
              "axis": null
            },
            "opacity": {
              "condition": {
                "test": {
                  "field": "__selected__",
                  "equal": "off"
                },
                "value": 0.3
              },
              "value": 1
            }
          }
        },
        {
          "transform": [
            {
              "window": [
                {
                  "op": "rank",
                  "as": "windowMinMax"
                }
              ],
              "sort": [
                {
                  "field": "001_ Total sales",
                  "order": "ascending"
                }
              ]
            },
            {
              "filter": "datum.windowMinMax ==1"
            }
          ],
          "name": "_MIN_BAR",
          "mark": {
            "type": "bar",
            "tooltip": true,
            "fill": "#c1595d"
          },
          "encoding": {
            "y": {
              "field": "001_ Total sales",
              "type": "quantitative",
              "scale": {"zero": false},
              "axis": null
            }
          }
        },
        {
          "transform": [
            {
              "window": [
                {
                  "op": "rank",
                  "as": "windowMinMax"
                }
              ],
              "sort": [
                {
                  "field": "001_ Total sales",
                  "order": "descending"
                }
              ]
            },
            {
              "filter": "datum.windowMinMax ==1"
            }
          ],
          "name": "_MAX_BAR",
          "mark": {
            "type": "bar",
            "tooltip": true,
            "fill": "#269595"
          },
          "encoding": {
            "y": {
              "field": "001_ Total sales",
              "type": "quantitative",
              "scale": {"zero": false},
              "axis": null
            }
          }
        }
      ]
    },
    {
      "name": "_Mean_Reference_Line",
      "transform": [
        {
          "filter": "datum['Month'] == 1"
        }
      ],
      "mark": {
        "type": "rule",
        "tooltip": true,
        "orient": "horizontal"
      },
      "encoding": {
        "y": {
          "field": "_MeanTotalSales",
          "type": "quantitative"
        },
        "color": {"value": "orange"},
        "size": {"value": 3}
      }
    }
  ]
}
Hope it helps.
Greg
eDNA Forum - Deneb X-axis Sorting.pbix (5.0 MB)
Thank you so much @Greg ,That’s really helpful.
Daniel