Wrong values in table

Hi,

How could I fix this measure? I have few main channels and would like to know how many unique orders we have got by channel.

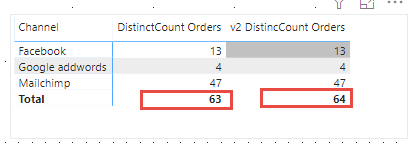
How to know if the problem is with total (13+4+47 = 64) or row values?

DCBDD782-89FD-472A-A2D4-DE81B409872B

It seems that total of unique values is correct (63)

File is attached.OrderTable1.pbix (37.5 KB)

Thanks in advance

Hello Vladas,

Perhaps you can use Power Query Editor to profile the data by:

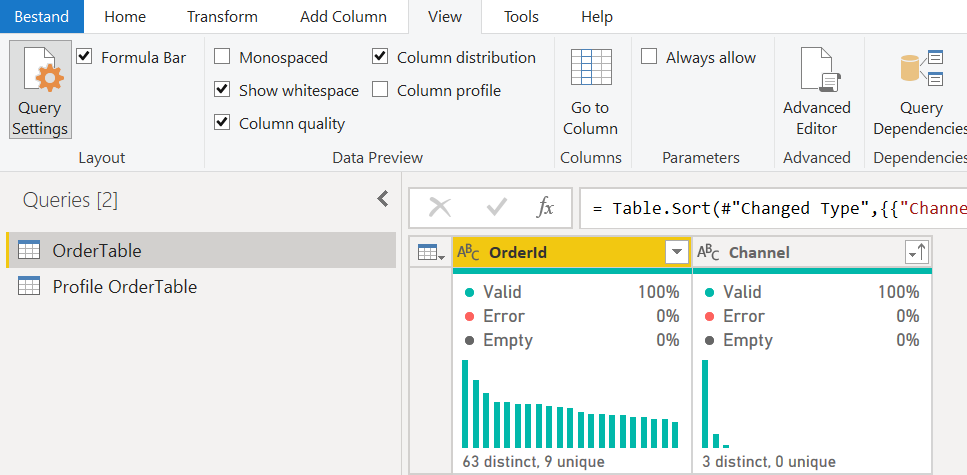
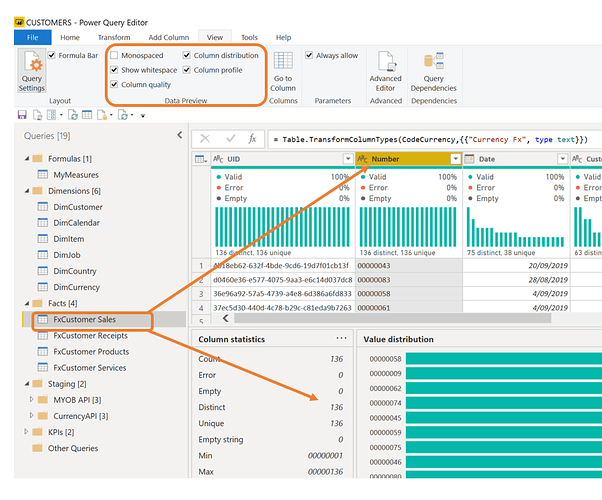
a) using the option Column distribution under the View tab in the Power Query Editor.

or

b) creating a blank query and use the next formula in the Power Query Editor:
=Table.Profile(OrderTable)
This will create a query that shows you a summary of the table with total distinct values etc.

I hope you can use it to find the source of the problem. Sometimes totals confuse me too :thinking:

Daniel

The solution is relatively straight forward, you have one OrderId belonging to multiple Channels.
So yes there are 63 distinct values but if you split them up by Channel the OrderId is counted as distinct by each Channel. Hope this makes sense.

OrderTable1

1 Like

That’s a great explanation @Melissa… I really didn’t knew that.

Daniel

@uriah1977 a count rows should advise you of the rows in the table. this tells you how many sales lines are in the table.

@GarryA I often use countrows, but in this case I couldn’t explain the total.

I think @Melissa point here is important with fact tables and understanding how the data is organised in the table.

They can be control tables where you have one line representing a date and a value /qtyv transaction. So a count row, count id or distinct id(should in most cases) will calculate the same on the ID column of a fact table.

Or you could be querying a sub-ledger of the control table…in this case the Id column in the control table is repeated for each transaction line as the value is split into dimensions like channels, products, jobs etc.

@Vladas @uriah1977 …Forgot to mention the Profiler/Distribution/Quality View is super useful when reviewing your tables, I use it to check the invoice numbers are unique in the sales control ledger of accounting systems

2 Likes

Guys, that do you think about this:

Image

Measure1: DistinctCount Orders = DISTINCTCOUNT(OrderTable[OrderId])

Measure2: v2 DistincCount Orders = IF(HASONEVALUE(OrderTable[Channel]);[DistinctCount Orders]; SUMX(VALUES(OrderTable[Channel]);[DistinctCount Orders]))

Now the sum is correct, and total is 64. But we know that we have 63 distinct values on the table. Is it correct?

Do you have any ideas? How many unique orders by channel?

Great, now I know where the problem is. Maybe I need to use one channel per OrderID? It will not be the same but total would be more accurate…

OrderId Channel
11002D21.10.2019 00:00:00 Mailchimp
11002D21.10.2019 00:00:00 Google addwords

Maybe we need to describe rule to use max value or rank? In this case could be “Mailchimp” as channel for this order: 11002D21.10.2019 00:00:00

@Vladas you’re looking at a transaction detail file that’s why the invoice lines are split and order ID repeated. You can think of a channel as a job-costed transaction that is part of a single order for a customer on a specific date which may or may not contain many jobs, products, services.

This is similar to the setup with any sales ledger system when they sell multiple lines of services or products to customers. There is normally always a summary and a detailed ledger.

Maybe your sales order systems have a summary ledger you can access the data from?

@GarryA I don’t have access to this type of data so it is complicated.

We know that the problem appears because of multiple lines as @Melissa mentioned.

I conceder that possible solution could be to create a column with most common channel value for unique OrderID, maybe it will be enough. I know that it would be preliminary channel value.

For example in this case it should be MailChimp in every row.

Do you have ideas how to do that?

@Vladas

So if I understand correctly the Channel that is repeated the most is considered the main Channel - sound like a job for Power Query.

First added a counter column and a Table.Group step were all rows for each [OrderId] are collected:

Table.Group(#"Changed Type1", {"OrderId"}, {{"All Rows", each _, type table [OrderId=text, Channel=text, Number=number]}})

In the following step I summed the counter, sorted it decending and returned the first value:

Table.AddColumn(#"Grouped Rows", "Main Channel", each List.First( Table.Sort( Table.Group([All Rows], {"Channel"}, {{"Number", each List.Sum([Number]), type number}}), {{"Number", Order.Descending}})[Channel]), type text)

Finally I expanded All Rows again, so you,'re back to where you started if this is not necessary because you don’t need all rows in your model, you could delete that step. Here’s the full query

let
    Source = Table.FromRows(Json.Document(Binary.Decompress(Binary.FromText("7d1BT8IwGMbxr0J2NqTrBDbPRE5+AsJhMoJEzAwc+PoqF3Xp5qNurCv/hOMvrGMpbd+9b7tcRnFsjJ2beBybsTVxNjLm7vyJbqKHfLdfP+1eXqPVDRKJ9FzeuuR9vt48luXzVzhrHaZyI5FIJBKJ/KWM5aEQGZScIJFByKk4obZy50AOVS7KcrvfjPKiOJWH4uh5a7u7L9/8UH7n8GSLT9bKLUGGJOWhGBmUzJBhyGmW1USykchwpRYOQSKRjVIKJyP7lNo68SylGSAS2ZbMElOTc1EJ055hIn8lEolEeibfGRKJRCI/pRS26Uw6026Rw5RWfu7IlqX0wgGJ/FkmUsgKiUQikX+S1tpEK3hDIpFIJBKJRCJ9lkpqDBKJvLiUUguRSP+lkuCGDE5K5XFIJPLapPJ+E4lEIpFIZKAyUXJfkcge5MRO5sY5p/1ecgcEAoEDgM76Oxd0vqYAAj2H7ug0EBgMFA6/ALYI3YVdQGCr0F2JAAQCPYNpmtacQVUNISGRyCYpbT+BRCKRyH9IaXdTJBIZhpRKTZDIZpklVhxlkMiApNw79H6ERCKRF5LONNxKMFuFyTSrO4Ggcu3upHLnVy9jJbnVB6kUkiKRPUmpnBHZr1QOlOhOKmUuSGQPMv04bkVZ6yKRSOTVSGnjIiRSkdKqHNm+dK8RFmW53W9GeVGcykNx9Nk7VxkN3vn/1uCldS4Siby4FKoZk2w2087LRCL7ktKkG4lEDliu3gA=", BinaryEncoding.Base64), Compression.Deflate)), let _t = ((type text) meta [Serialized.Text = true]) in type table [OrderId = _t, Channel = _t]),
    #"Changed Type" = Table.TransformColumnTypes(Source,{{"OrderId", type text}, {"Channel", type text}}),
    #"Sorted Rows" = Table.Sort(#"Changed Type",{{"Channel", Order.Ascending}}),
    #"Added Counter" = Table.AddColumn(#"Sorted Rows", "Number", each 1),
    #"Changed Type1" = Table.TransformColumnTypes(#"Added Counter",{{"Number", Int64.Type}}),
    #"Grouped Rows" = Table.Group(#"Changed Type1", {"OrderId"}, {{"All Rows", each _, type table [OrderId=text, Channel=text, Number=number]}}),
    #"Added Main Channel" = Table.AddColumn(#"Grouped Rows", "Main Channel", each List.First( Table.Sort( Table.Group([All Rows], {"Channel"}, {{"Number", each List.Sum([Number]), type number}}), {{"Number", Order.Descending}})[Channel]), type text),
    #"Expanded All Rows if needed" = Table.ExpandTableColumn(#"Added Main Channel", "All Rows", {"Channel"}, {"Channel"})
in
    #"Expanded All Rows if needed"

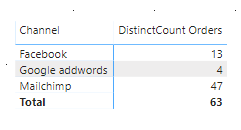
Now when the Main Channel is placed in the visual on the right, you can see it all adds up.
OrderTable2

You can follow along with the steps in the query editor, I hope this helps.
OrderTable1.pbix (40.2 KB)

General advice, if you use this method be very explicit about it and get consensus from your stakeholders because you have changed the dataset.
2 Likes

You solution works great. This is exactly that I need. Thank you for your help and advice! I will talk about this with stakeholders to avoid misunderstandings.

@Melissa,

Your knowledge of M and PQ is fantastic. I’m wondering where/how you learned this, since while there is an abundance of great DAX resources, I haven’t found a fraction of that number devoted to M.

  • Brian

@BrianJ

Yeah I agree with you there, far to little good resources on Power Query M, at least that I’m aware of.
I’ve listed some below altough these are pretty well known but maybe others can add to this list…

YouTube
Mike excelisfun Girvin Power Query (Get & Transform) Video Playlist
Oz de Solei Get and Transform (Power Query)

Blogs
Chris Webb https://blog.crossjoin.co.uk/
Imke Feldmann https://www.thebiccountant.com/
Ken Puls https://www.excelguru.ca/blog/
Gil Raviv https://datachant.com/

1 Like

@Melissa,

Awesome - thanks! While I’m working my way through Gil’s book now, some of these are new to me. I’ll definitely add them to my regular reading/viewing list.

  • Brian