Hi all,
I’m curious if anyone has further ideas that may assist with an issue in my model. I have tried the PowerBI forum but I’m only getting answers I knew and was trying to avoid.
I’ll try to summarise here but please also see my detailed post here.
-
I have 2 x resource tables, Actuals and Forecast. The Forecast has a lot more fields than Actuals
-
I have a large number of measures running over these tables so I’m hesitant to append the 2 together. I initially made the decision not to do that as I was concerned about how big it would make my model by having all the additional irrelevant forecast fields next to actuals data
-
I am currently using master tables to create a relationship for the 2 or 3 key columns we often use in visuals (like ‘Submitted By’) but if we drop in any of the other inconsistent fields to a visual, it will break the calculation as depicted in the post.
I’m trying to improve my knowledge by understanding if there’s a way to write a measure which would only return actuals against ‘blank’ if there is a filter on one of those inconsistent fields.
Secondary, what is best practice? Should I have just joined the 2 x tables from the get go?
Thanks in advance!
KC
Can you add some images of the model and what the tables look like.
You shouldn’t have to merge them, in fact I would always recommend keeping them separate and then using DAX measures to compare the data from them.
There can sometimes be a bit to these as you need to combine a quality model with the right measures but it can generally be done.
I would just need to know more and see more around the model and these many variations.
I have covered these concepts a lot.
Check out this module if you haven’t already.
If you want to add a sample pbix file I’m happy to have a look at it.
Also let me know what visuals you’re looking to have these in.
Thanks
Hi Sam,
Thanks for your reply. Apologies for my delayed response. I’m living in Sapporo at the moment and we had an earthquake last week that wiped out utilities on the island. I’m still catching up!
I did actually sneak in watching the entire training session you recommended before we lost power. Between that and reading one of the Italian’s books I had on hand, I am assuming the solution will either be
That said, I’d still appreciate your input as I’d like to make sure I’m taking the best approach. I can’t share the model as the complexity makes it difficult to censor. However, I’ve included what I can.
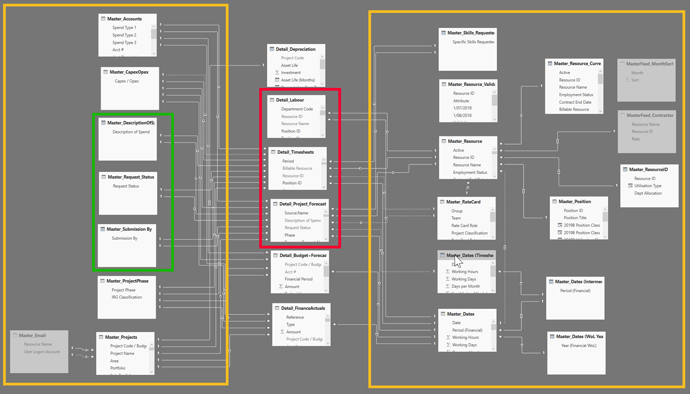
For context, this is the model. It’s evolved over time so I acknowledge needs simplification.
- Yellow = Master Tables
- Red = 3 x Fact tables under discussion
- Green = 3 x Master tables added as an interim solution over 3 fields that exist in Detail_Project_Forecast but not in Detail_Timesheets (I’ve ignored Detail_Labour for now but the same context applies)
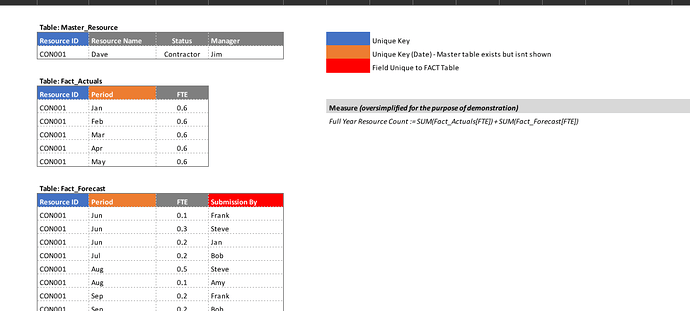
This file then shows the three tables in red. It isn’t a perfect representation of what I am trying to achieve but it is close enough in that the green sections are the relationships, and the orange sections are all the fields that are unique to the table but may be used in a visual. The grey is irrelevant.
Forecast and Actual Tables.xlsx (13.1 KB)
There’s also a ridiculously simplified example of what I’m trying to achieve in the original thread I posted on the PowerBI forum - you can find the file here
Thanks in advance. This is a beast of a question for a forum, but I’m a bit stuck.
Thanks
KC
This is a complex model here. Some real simplification needs to take place I think.
Certainly a number of changes I would make to the model especially. Try to go through this course module when you can. It will make things a lot more intuitive.
I personally feel you should be able to merge many of these lookup tables together so you have far less of them.
I would rarely if ever need this many tables inside a model to get solid insights.
Just looking at this below also.
I think you might be over thinking it here.
If you want to analyze these together then you need to link them by something common. That’s the month column to me.
What I would do is I would add columns to this tables and have that column be an actually date. Like the first date of the month. Then have these two tables linked back to a date table.
Then with that simple move, you can easily then start filtering by time frame and use simple sum formulas.
Do you see where I’m going with this idea?
Hi Sam,
Thanks for your advice. I’ll definitely look to combine some of the lookup tables as you’ve suggested and complete the additional training module.
I actually built this model 1 month after learning PowerQuery and DAX, so naturally I’d do it differently now I have significantly more experience and knowledge. It is now the primary reporting tool for all our resource and financial reporting in the area I look after so it is a slow process to fix without breaking all of my existing reports. My stakeholders don’t see the complexity just insightful reporting which is of course the main thing as I tinker in the back end to simplify.
That said, I’m not sure this solves my issue though. The screenshot you referenced above is a simplified view. The two tables are definitely connected by proper dates and resource IDs. This doesn’t take away the issue though that “Submission by” is not present in Fact_Actuals. So even though they are related, if I drop “Submission By” into a table visual alongside Full Year FTE (Actuals + Forecast), the ‘Actuals’ would repeat against every different combination of submission by as shown here:

Cheers
Kirsty
Ok great.
Yep you’re correct there is no connection if you want to filter by ‘submission by’. The reality with it though to me is you just can’t filter by it. There’s no logical relationship.
If the data is not there and there is no logical relationship then they just can’t be filter by each other. The only common column I see if the date, so that’s really the only filter you can have naturally occur.
Potentially you could find some sort of allocation methodology for the FTE forecasts across each submitter, but I can’t see it anywhere so I’m not sure what that would be. You would have to complete any type of allocation within DAX formula.
I discuss a similar concept around budget allocation here (it’s not the same, but similar concept)


