I have been tasked with analyzing and improving varied open data sources on a public website. the question is how can I use power bi to do this and is there any suggestion how to do this with low maintenance in the future. Any helpful resources to look at will also be appreciated. Thank you
Hi @damoako ,
It’s always very useful to see other experiences on that topic.
Here are some of my observation (maybe someone else can add their experience as well).
Get data part:
- Dynamic URL connections
Some additional links that you might find interesting:
Maybe you will need some tuning some network access parameters (depend of your corporate policies).
- Check / select structured part that you can use
- Check structures that can be use in Load part
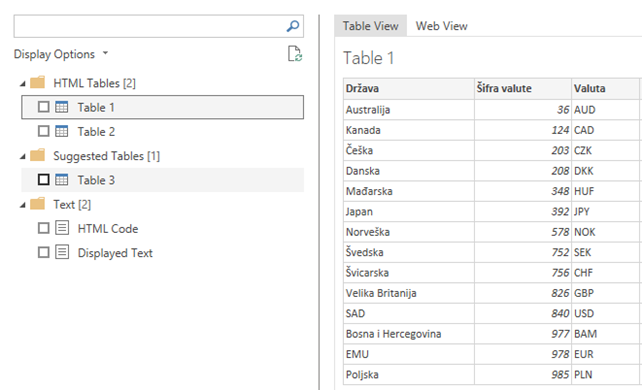
Notice that there are Table and Web view ( I used Table View)
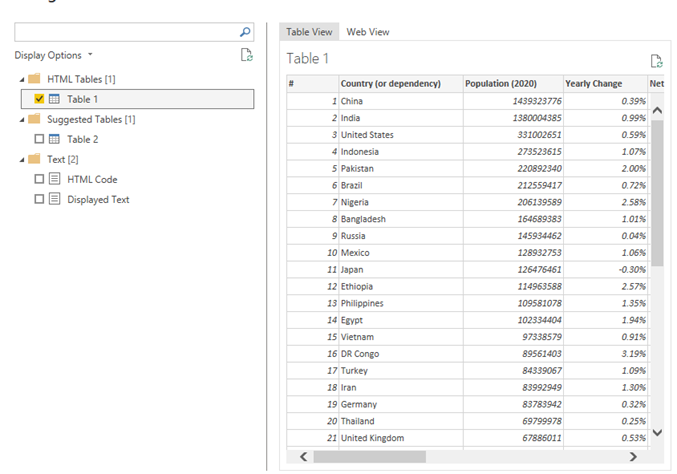
Be aware that Suggested Tables maybe will not be the best options – check the preview
I notice in some open web pages – there are lots of unstructured parts and I often need to copy exact document URL to for example Excel that I would like to use (specially on some regulatory, statistics websites)
Some additional guidelines you can find at:
Transformation part
- Usually there are lots of transformations that need to be done before you can use open source web data
- Luckily Power BI have Applied steps part so it is much easier to maintenance and insert / change steps later if needed
- Keep in mind business context and extracting business value (for example you might use some figures but you need to bring in your business context that you can use – for example:
- if you use stock exchange price for some raw materials – if you can bought it directly on that market on that price – you need to add context (additional suppliers fees, you need to put additional freight and other cost etc.)
- If you use foreign financial statements – maybe some mapping needs to be done + currency conversion
- If you use it to comparison – additional context and calculation need to be done – just thing about how you can use those figures and data in your business environment
Be aware that there are also K-Teams Power BI custom visuals HTML & CSS Viewer in Power BI - Pascal Kiefer have lots of presentations on that topic.
For Data Transformation part – you can check Sam’s Data Transformation and Modelling course:
Available at:
https://app.enterprisedna.co/app/player-course/8
If you need more M code lectures – I highly recommend Melissa’s courses:
- Fundamentals Power Query & M (more theoretical)
- Applied Problem Solving with Power Query /M (6 practical example cases )
Available at:
https://app.enterprisedna.co/app/player-course/19
https://app.enterprisedna.co/app/player-course/25
Good luck.
Thank you. will look into the resources.
Another useful resource might be the EDNA course “Accessing Data via APIs in Power BI”, https://app.enterprisedna.co/app/learning-courses?id=132
Hello @damoako
Did the response above help solve your query?
If not, can you let us know where you’re stuck and what additional assistance you need?
If it did, please mark the answer that helped you as the SOLUTION.
Thank you
Hello @damoako ,
Due to the length by which this post has been active, a response on this post has been tagged as “Solution”.
Thanks to the contributors of this post.
For further questions related to this post, please make a new thread. Please feel free to reopen this thread if anyone would like to answer the pending inquiry above.
Thank you