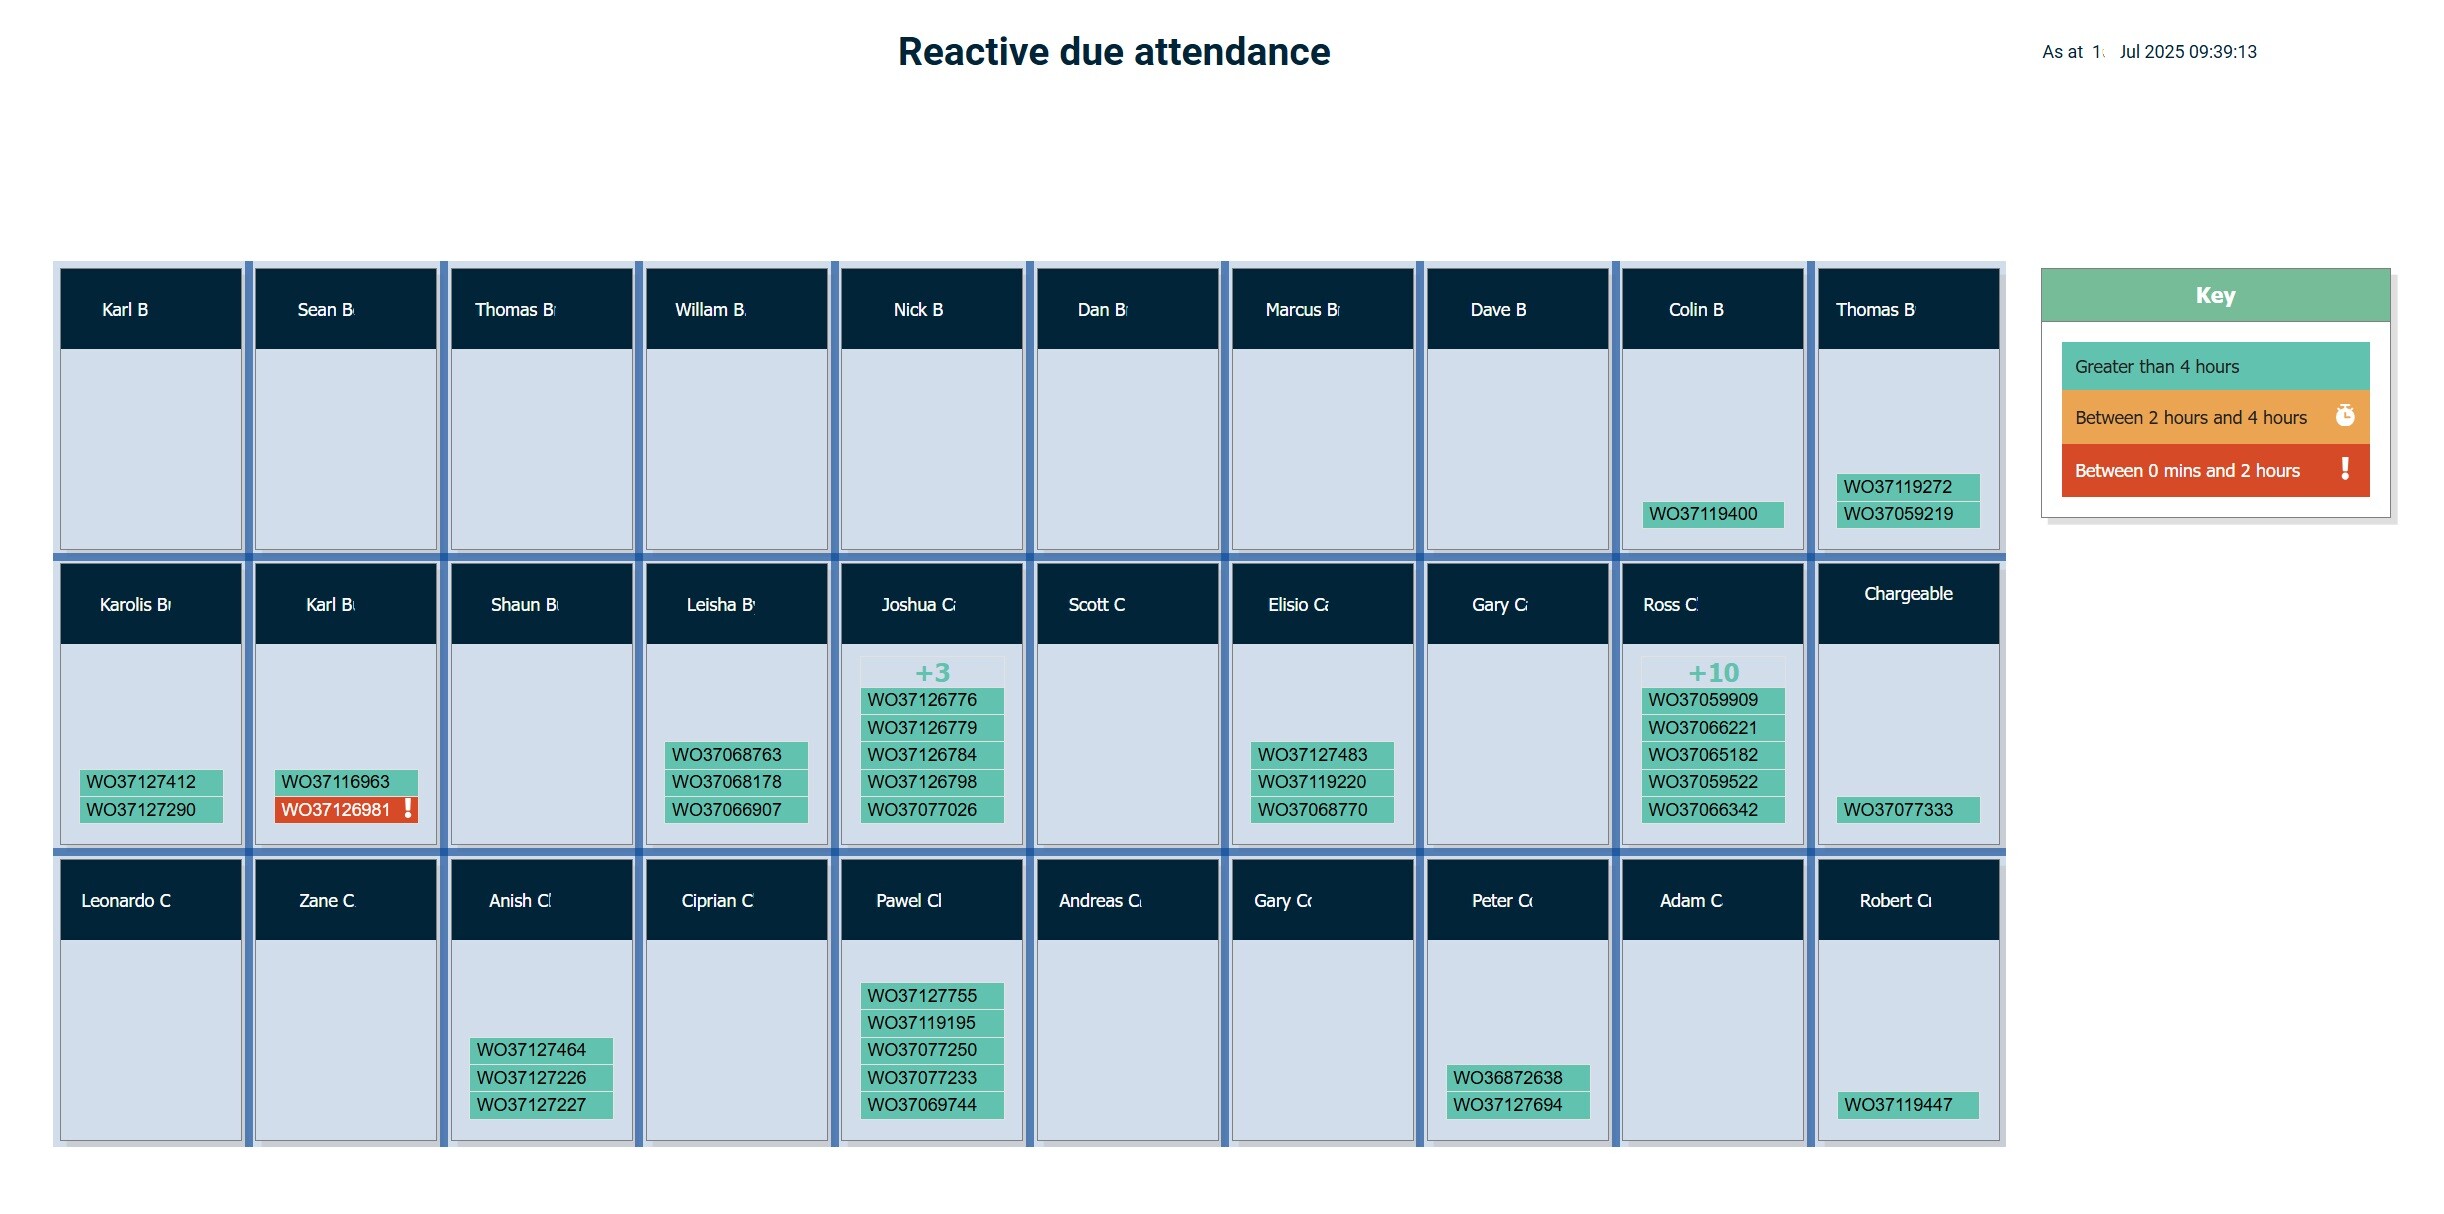
I have previously been able to visualise in another reporting tool a work order management report as per the example attached.
Has anyone got any idea or examples of how i could visualise multiple work order numbers formatted by time remaining in different buckets per engineer capped with the 1st 5 WO numbers showing and the amount remaining if applicable in the bucket
Yes, you can do something like this. You can do it like this:
Add a column in your data to tag each work order by how much time is left (like Due Today, Due This Week, etc.). Group by engineer and bucket in your report.
To show just the first 5 work orders in each bucket (plus +X more if there are extras), you can use a DAX measure with CONCATENATEX and TOPN, then another one to count the extras. Combine these two so each cell says something like: WO1, WO2, WO3, WO4, WO5 +2 more.
It takes a bit of DAX, but it’s doable. If you want a real Kanban look, you might need a custom visual, but basic Power BI can handle most of it.