Which type of Visual is it?

Hi friends i got a report…in which there seems a table visual on very first page of report .The page name is Business Construction. When i am clicking on it the none of the visual in visualization pane is getting selected. In fact it looks like table only but table visual is not getting highlighted. Please guide what is it and how it can be constructed? I am attaching pbix file…please guide.

regards
Gantt.Gantt1448688115699.2.2.3.0.pbix (534.0 KB)

*** READ FIRST ***

Before you send your question.
Make sure that all details relevant to your question is complete:

  • Your current work-in-progress PBIX file - VERY IMPORTANT
  • A clear explanation of the problem you are experiencing
  • A mockup of the results you want to achieve
  • Your underlying data file

Check out this thread on Tools and Techniques for Providing PBIX Files with Your Forum Questions

Also make sure that your data file contains no confidential information. If it does, click the link above.

*** DELETE THIS MESSAGE IF YOU ARE SURE ALL YOUR DETAILS ARE COMPLETE OR IF THE ABOVE INFORMATION IS NOT APPLICABLE TO YOUR QUESTION.***

@praveer82 ,

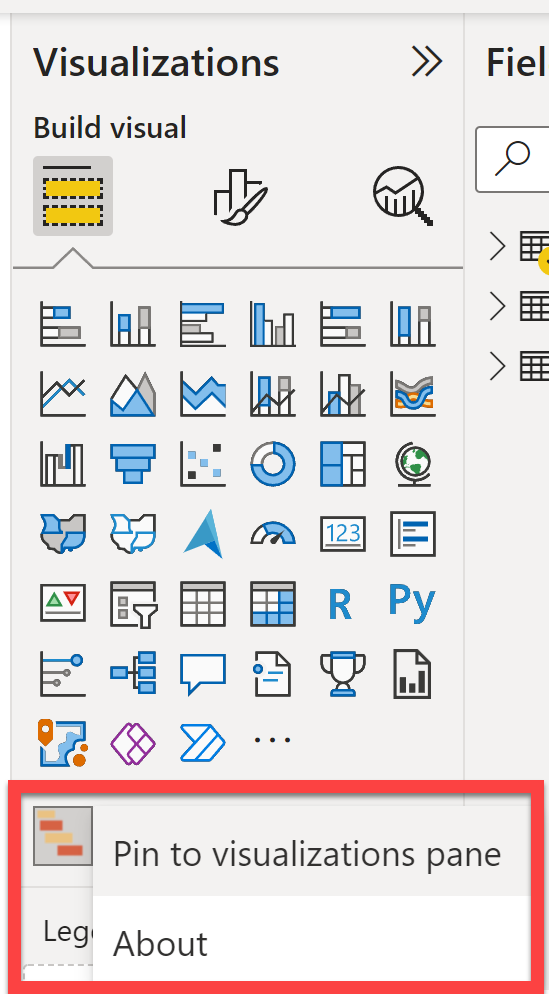
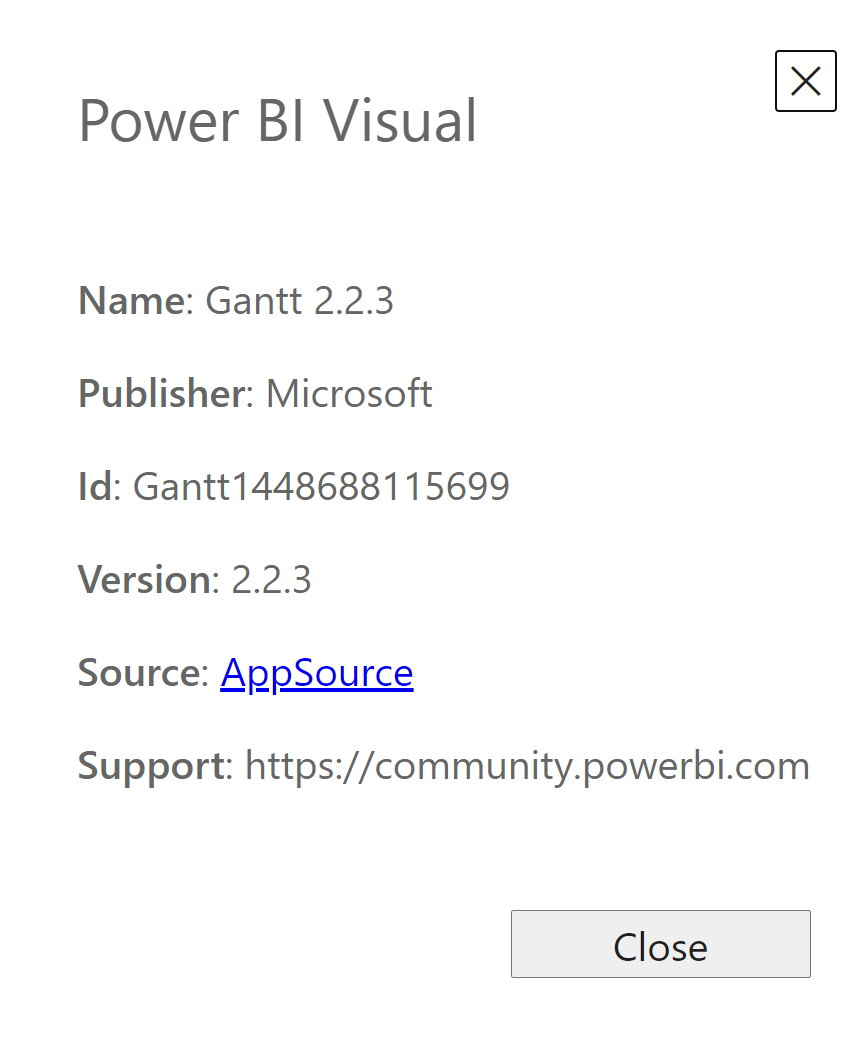
When you click on it, the custom visual in the visuals pane is what’s getting highlighted. If you go to that visual and right-click on it, and select “About” will provide further information

In this case it’s the Microsoft Gantt chart 2.2.3 custom visual.

I hope this is helpful.

  • Brian
1 Like

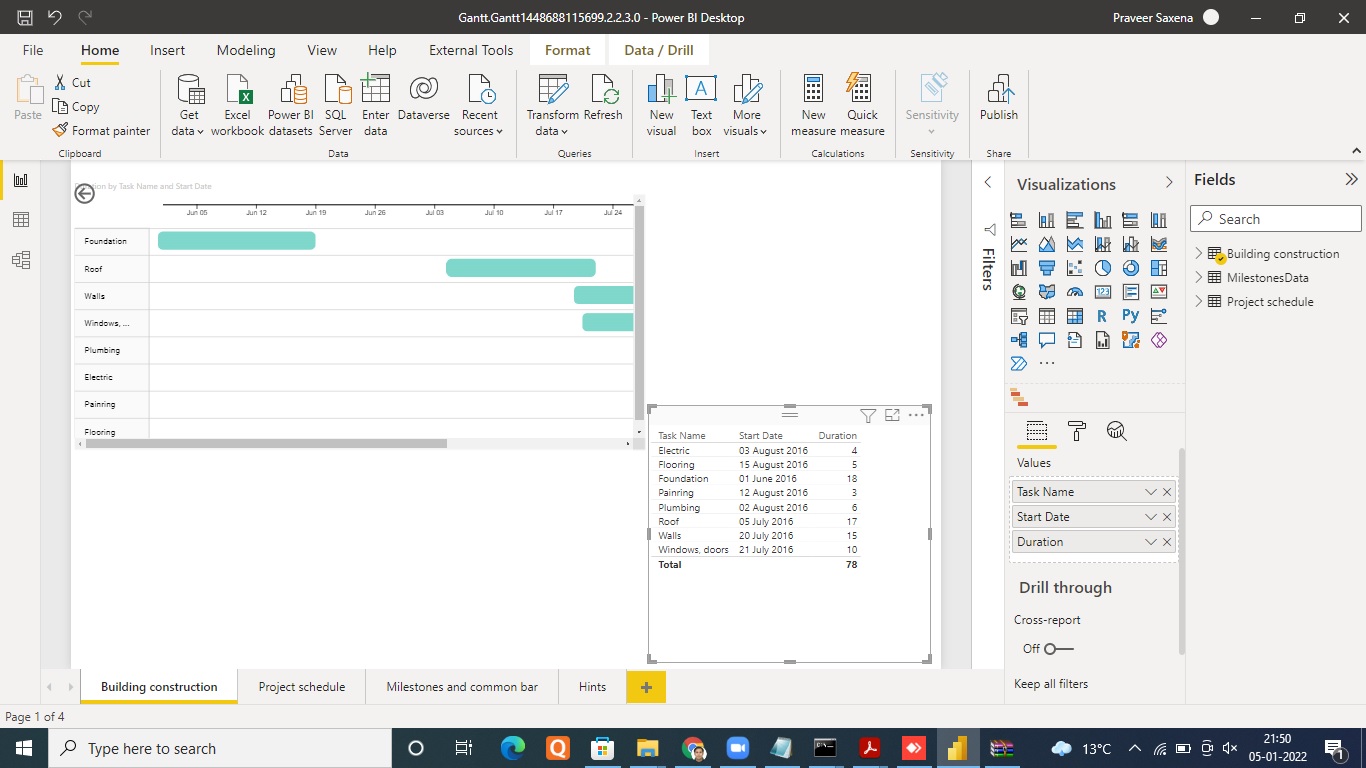
hi sir, i am talking about the sort of table visual available next to custom visual in the building construction page.when i am clicking on it …nothing is getting highlighted…please see.
regards

@praveer82 ,

When I click on it, all the information seems to highlight just fine (see screenshot below)

What version of Power B are you using?

– Brian

Thanks a lot sir for your prompt response…actually its not highlighting in my case i am using
Version: 2.100.785.0 64-bit (December, 2021)…can you suggest what could be the issue? regards

@praveer82 ,

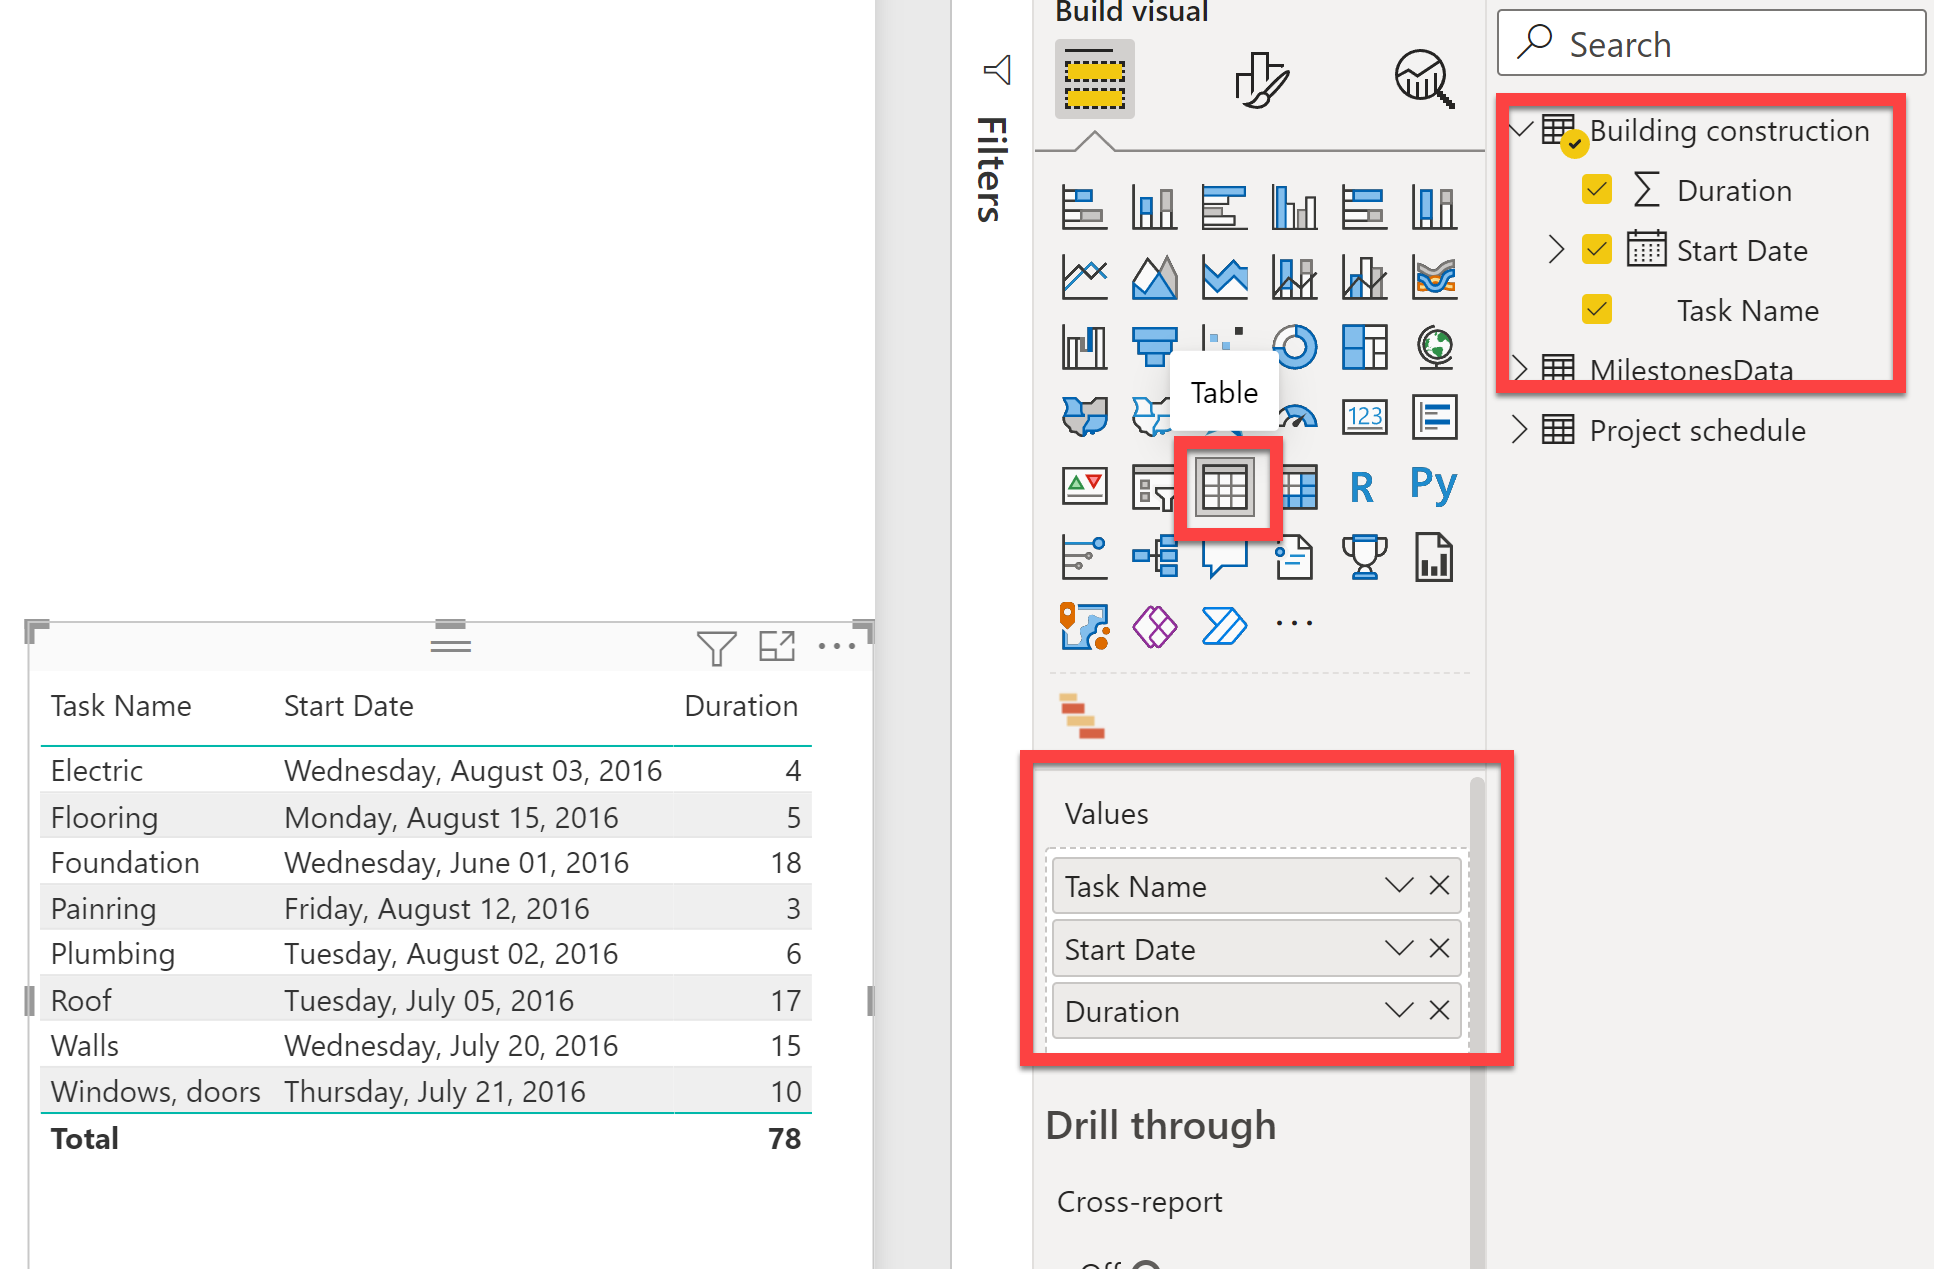
Can you please do a similar screenshot to my one above which shows what you see (or don’t see) in the visualization and fields panes when you click on the table visual in the report?

Thanks.

– Brian


sure sir …please check.

regards

Okay, so you’re getting all the correct information just not the gray highlight around the table icon.

Try clicking on the Gantt chart and then back to the table to see if that forces a refresh of the highlighting in the visuals pane.

  • Brian

Dear sir,

i tried but its not working…

regards

Okay, I have one more thing to try. With the table selected, click on the matrix type visual in the visuals pane and then click back to the table type and see if that restores the highlighting around the table type.

– Brian

2 Likes

Thanks a ton sir that worked…regards

2 Likes