Hi Team,
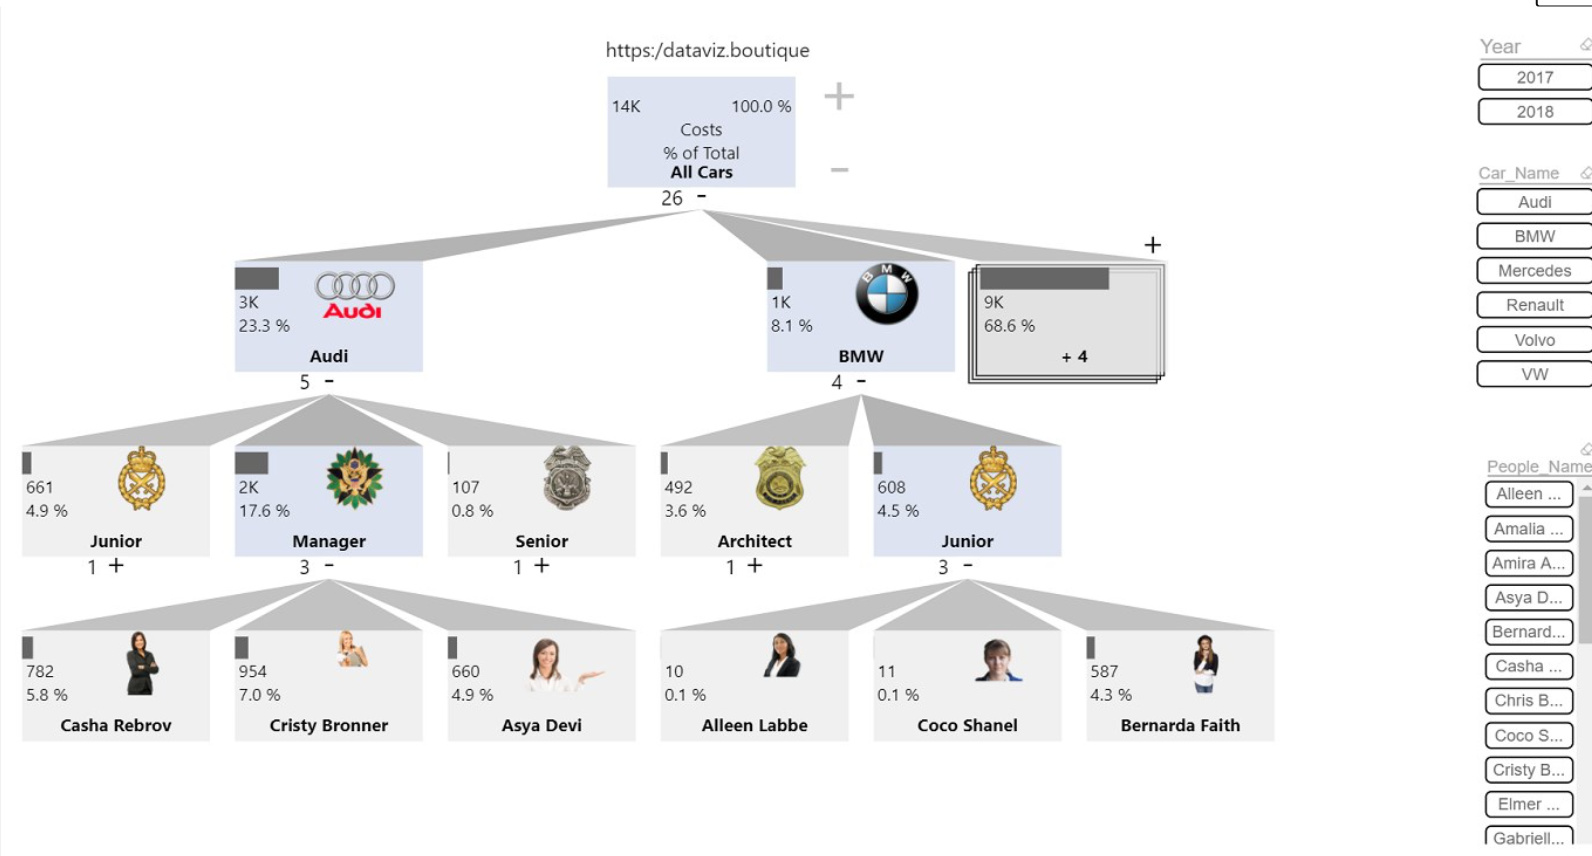
Need your help in finding the way to achieve the below scenario analysis. Is there any custom visual available to achieve this or any suggestion to get the same result?
Hi Team,
Need your help in finding the way to achieve the below scenario analysis. Is there any custom visual available to achieve this or any suggestion to get the same result?
Hello @putturps,
Thank you for posting your query onto the Forum.
Well, you can firstly use the normal “Decomposition Tree” visual which is available in Power BI. But if you want to go for the customized visual I’m providing few of links below where you can check out what features are available with them.
Also providing few more links on it about how to create this type of visualization.
Hoping you find this useful and meets your requirements. ![]()
Thanks and Warm Regards,
Harsh
https://www.sqlshack.com/the-decomposition-tree-in-power-bi-desktop/


Hello @putturps
Have a look at this decomposition tree
https://appsource.microsoft.com/en-us/product/power-bi-visuals/WA104381663?src=office&tab=Overview
Regards
Kumail Raza
Hi @putturps, we’ve noticed that no response has been received from you since the 14th of October. We just want to check if you still need further help with this post? In case there won’t be any activity on it in the next few days, we’ll be tagging this post as Solved. If you have a follow question or concern related to this topic, please remove the Solution tag first by clicking the three dots beside Reply and then untick the checkbox. Thanks!
Hi @putturps, a response on this post has been tagged as “Solution”. If you have a follow question or concern related to this topic, please remove the Solution tag first by clicking the three dots beside Reply and then untick the check box. Thanks!