Hello all!
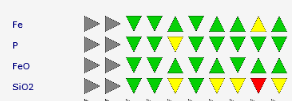
I need to replicate the visual in the image below but am unsure how to approach it, I’m hoping someone here can help. Is there a visual for this?
The X axle displays the products.
The Y axle displays the number of tests conducted on the products and returns some kind of arrow depending on the outcome of the test. The user needs to choose how many tests that are shown on the axle.
Can any of you guide me towards how to achieve the visual?
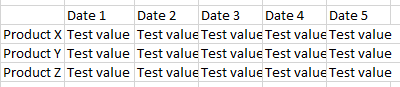
Hello @Kristoffer.Dahlquist. Thanks for posting. The first thing I thought of is just a table with conditional formatting applied to the values. In the format, you want to set up rules. If a certain value then UP green arrow and so forth.
Let me know if that is what you were thinking
Paul
Hello!
Yes that was my first thought, something in the likes of the image below. But that might make the table very wide in the case of many tests over long periods of time. But if i unpivot it, the values get vertical instead of horizontal.
I do not have access to the underlying data yet so I don’t know how it is structured. It will probably be a tall narrow table if I were to venture a guess.
1 Like
Hi @Kristoffer.Dahlquist,
Do you have any updates regarding this inquiry?
Please share it here so our experts can further explore possible solutions to this inquiry.
Thank you!
Hi @Kristoffer.Dahlquist
Due to inactivity, we’d like to conclude that you no longer require assistance to solve your inquiry.
If you have a follow question or concern related to this topic, please remove the Solution tag first by clicking the three dots beside Reply and then untick the check box.