Sure – I love this stuff, so always happy to write a bunch of DAX. 
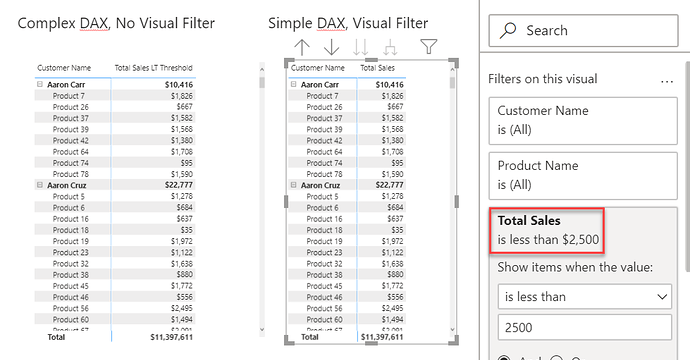
This should provide some much-needed respect for the humble visual-level filter though:
With visual filter - DAX measure: 1 line
Without visual filter - DAX measure: 59 lines
Here’s the measure:
Total Sales LT Threshold =

VAR Threshold = 2500

VAR vTable =
ADDCOLUMNS(
    CROSSJOIN(
        VALUES( Customers[Customer Name] ),
        VALUES( Products[Product Name] )
    ),
"TotSales", [Total Sales]
)

VAR vTable2 =
FILTER(
    vTable,
   [TotSales] < Threshold
)

VAR ResultProdLev =
CALCULATE(
    SUMX(
        vTable2,
        [TotSales]
    ),
    FILTER(
        vTable,
        [Customer Name] = SELECTEDVALUE( Customers[Customer Name] ) &&
        [Product Name] = SELECTEDVALUE( Products[Product Name] )
    )
)

VAR ResultCustLev =
CALCULATE(
    SUMX(
        vTable2,
        [TotSales]
    ),
    FILTER(
        vTable,
        [Customer Name] = SELECTEDVALUE( Customers[Customer Name] )
    )
)

VAR TotalLev =
SUMX(
    vTable2,
    [TotSales]
)

VAR SwitchLev =
SWITCH( TRUE(),
    ISINSCOPE( Products[Product Name] ), ResultProdLev,
    ISINSCOPE( Customers[Customer Name] ), ResultCustLev,
    TotalLev
)

RETURN
SwitchLev
The side-by-side comparison is actually really helpful in understanding what this measure is doing:
vTable - replicates the matrix visual in a virtual table
vTable2 - replicates the visual level filter applied to vTable
ResultCustLev, ResultCustLev and TotLev - calculate the filtered totals from vTable2 at the different levels of the matrix hierarchy
SwitchLev - determines where in the hierarchy we are (via the ISINSCOPE function), and returns the proper total
One note - when you’re using ISINSCOPE with SWITCH(TRUE(), the order of statements is important – you need to start with the innermost element of the hierarchy (in this case product level) and travel outward (to customer and then total). In this case product is in scope of customer but not vice versa.
I hope this is helpful – good luck with your project! Full solution file posted below.
- Brian
eDNA Forum – Filter CalculatedTable solution.pbix (515.9 KB)
