What if parameter not working

Hi All,

I’ve been going round in circles trying to get this to work!

I am trying to create a matrix table that shows all SKU’s sold for the period below 50. I have created a What-if parameter as per one of Sam’s video tutorials and I have created a DAX formula, that should work. I tested the formula by creating a table and I get the expected result, and yet when i use the formula in my visualization I get a different result.

Any help would be greatly appreciated!

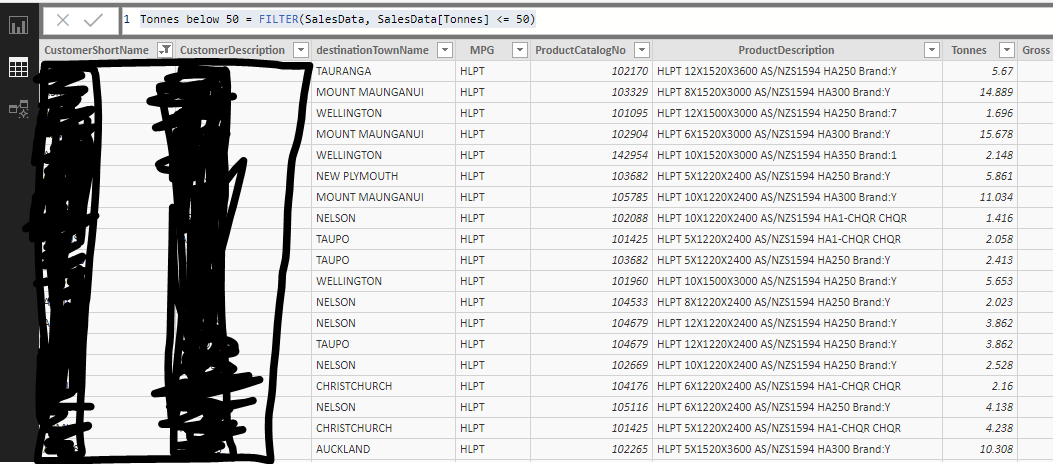
  1. My tested table

Tonnes below 50 = FILTER(SalesData, SalesData[Tonnes] <= 50)

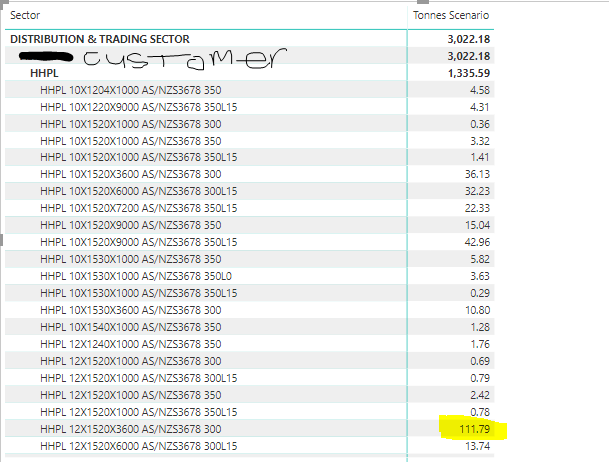
  1. My matrix and formula

Tonnes Scenario =
CALCULATE([Tonnes],
FILTER(SalesData, SalesData[Tonnes] <= [Tonnes Set Value]),
ALLEXCEPT(SalesData, SalesData[ProductDescription]))

image

@bgood,

This is happening because you’re working at different granularities. The tested table is filtering by row (individual sales observations), so is taking out any row with individual sales of tonnes > 50. But your matrix is totaling by product description, so a product may have multiple sales all less than 50 each that add up to more than 50 total.

I think what you want to do instead is to create a virtual table crossjoining customer and product description (basically to replicate the row structure in your matrix), then via ADDCOLUMNS, add the column with your total sales to that virtual table, and then filter by [Tonnes] < 50. Then from that filtered virtual table create a scalar measure that returns the proper value given your matrix context.

Hopefully, that makes sense. If not, please post a PBIX file, I’ll be glad to work through the specific DAX with you.

  • Brian

Thanks @BrianJ for your quick response. I’m not able to share the file as it’s sensitive.

My ultimate goal is to create a list of unique products by customer where the sum of their quantities for the entire period is less than 50. Is there an easier way, or are you able to give some formula examples that may guide me a bit?

Many thanks in advance!

@bgood,

OK - that’s what I thought you were trying to do. I’ve got some sample data that I can use to pop together a quick example consistent with your requirement, and then write the DAX to illustrate the approach above. Will have something back to you later this evening…

  • Brian

@bgood,

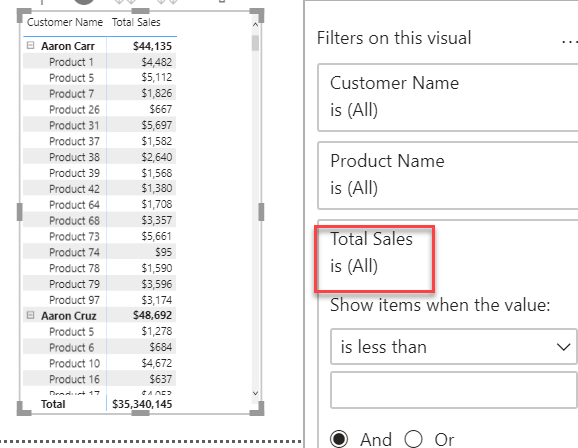
So what about just taking your matrix visual by customer and product (here using my sample data):

image

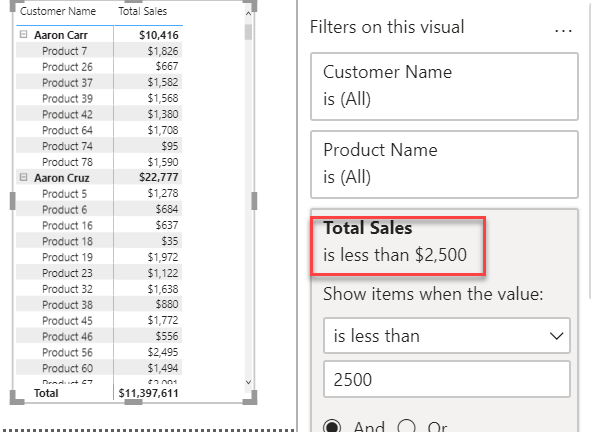
And just throwing a visual level filter on it, at the proper threshold level (here, 2500 for illustration purposes. 50 in your case)?

image

What I described above is the exact DAX equivalent of this, but doing it through the visual filter is much simpler.

Let me know if this works for you, or if you’d rather go through the DAX solution.

  • Brian

That is a great temporary solution! I’m sure i tried that before, but perhaps i had some other filters that prevented it from working correctly. It works fine @BrianJ :slight_smile:
I would however like to improve the model and the DAX solution would be really helpful if and when you have time.

Thanks so much.
Bronwyn

@bgood,

Sure – I love this stuff, so always happy to write a bunch of DAX. :grinning:

This should provide some much-needed respect for the humble visual-level filter though:
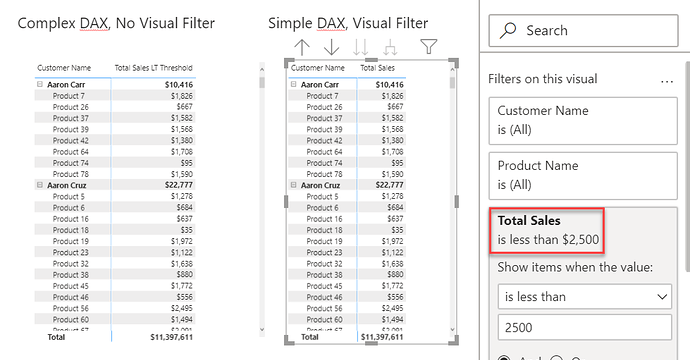
With visual filter - DAX measure: 1 line
Without visual filter - DAX measure: 59 lines

Here’s the measure:

Total Sales LT Threshold = 

VAR Threshold = 2500

VAR vTable =
ADDCOLUMNS(
    CROSSJOIN(
        VALUES( Customers[Customer Name] ),
        VALUES( Products[Product Name] )
    ),
"TotSales", [Total Sales]
)

VAR vTable2 =
FILTER(
    vTable,
   [TotSales] < Threshold
) 

VAR ResultProdLev =
CALCULATE(
    SUMX(
        vTable2,
        [TotSales]
    ),
    FILTER(
        vTable,
        [Customer Name] = SELECTEDVALUE( Customers[Customer Name] ) &&
        [Product Name] = SELECTEDVALUE( Products[Product Name] )
    )
)

VAR ResultCustLev =
CALCULATE(
    SUMX(
        vTable2,
        [TotSales]
    ),
    FILTER(
        vTable,
        [Customer Name] = SELECTEDVALUE( Customers[Customer Name] ) 
    )
)

VAR TotalLev =
SUMX(
    vTable2,
    [TotSales]
)

VAR SwitchLev =
SWITCH( TRUE(),
    ISINSCOPE( Products[Product Name] ), ResultProdLev,
    ISINSCOPE( Customers[Customer Name] ), ResultCustLev,
    TotalLev
)

RETURN
SwitchLev

The side-by-side comparison is actually really helpful in understanding what this measure is doing:
vTable - replicates the matrix visual in a virtual table
vTable2 - replicates the visual level filter applied to vTable
ResultCustLev, ResultCustLev and TotLev - calculate the filtered totals from vTable2 at the different levels of the matrix hierarchy
SwitchLev - determines where in the hierarchy we are (via the ISINSCOPE function), and returns the proper total

One note - when you’re using ISINSCOPE with SWITCH(TRUE(), the order of statements is important – you need to start with the innermost element of the hierarchy (in this case product level) and travel outward (to customer and then total). In this case product is in scope of customer but not vice versa.

I hope this is helpful – good luck with your project! Full solution file posted below.
1 Like

.

Great stuff @BrianJ just goes to show - if you use everything at your disposal within Power BI even DAX can become a breeze…

@BrianJ just WOW :dark_sunglasses: you’re the man.
Thank for for the very comprehansive example and lesson.
Much appreciated.
Bronwyn

@bgood,

Thanks! Really glad to hear that was helpful to you.

  • Brian