Hoping someone can help…
I have a graph showing prices over time, by major product grouping. I’d like to also show the weighted average in this graph (as a line).
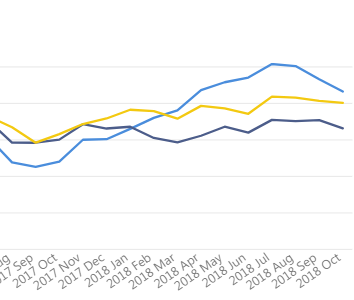
I can show this using the combination bar and line graph -
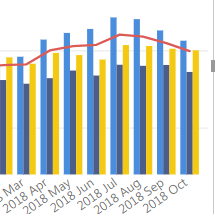
…but it doesn’t have the zing I’m after.
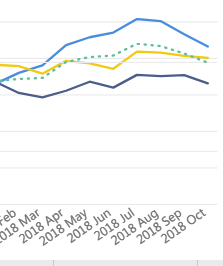
I want it more like this - (I’ve overlayed two graphs to give the idea but that isn’t feasible in a final model) -
Any advice? Hoping I can do it without more measures but if that’s the only option then I can deal with that.
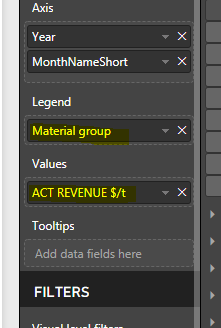
When placing something into the legend unfortunately you can’t add additional lines to the chart.
The way to get around this is to create individual measures for each line. Then you can stack them one on top of the other without using a legend.
You can do these quite quickly, all you need to do is use the CALCULATE and FILTER function.
It looks like to me you probably on need three measures to start with and then you can use those measures all within another one to create the weighted average.
See how you go with this.
Thanks for this Sam - you’ve confirmed my thoughts.
I’ll let you know how I go 